Open Access
Fig. 14
Download original image
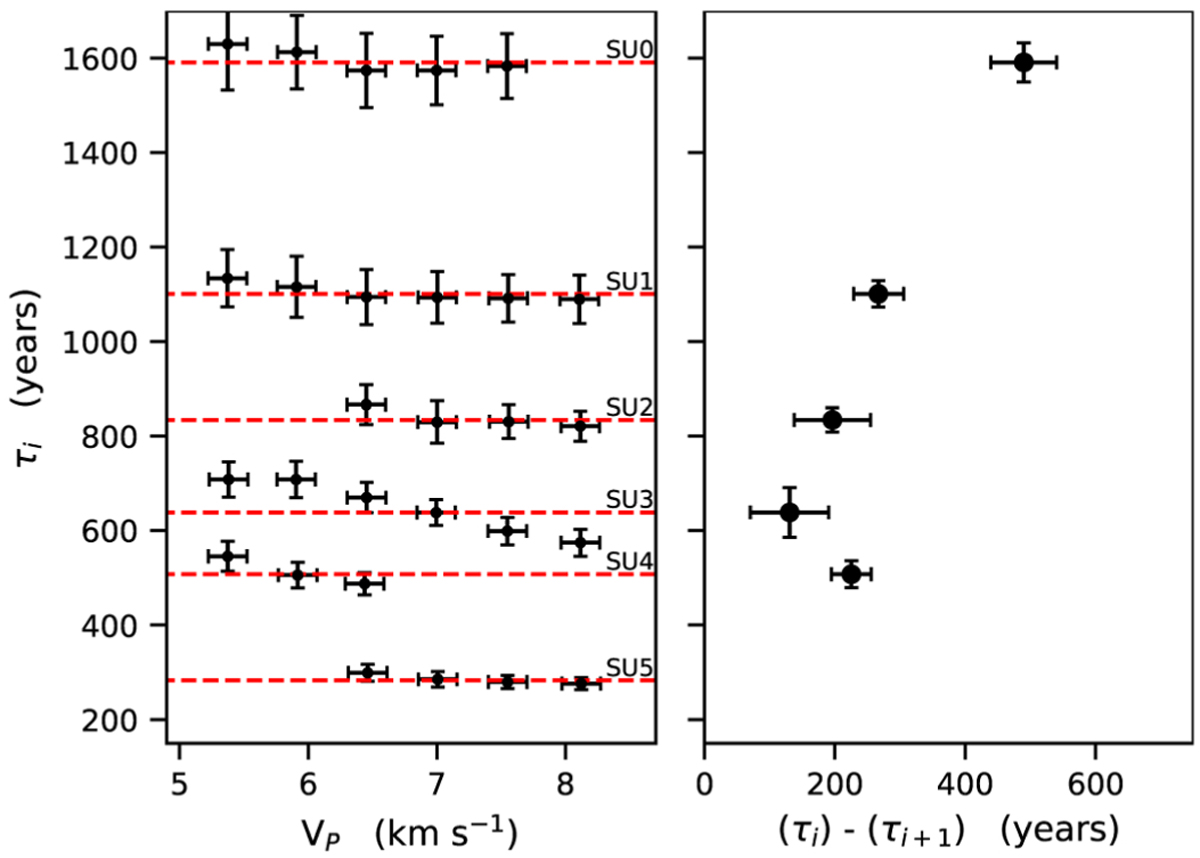
Dynamical evolution of the enhancements. Left panel: dynamical age ![]() of the enhancements SU0-5 as a function of VP. The red dotted line represents the mean value. Right panel: dynamical age versus timescale between adjacent cusps (τi − τi+1). The uncertainties are determined by propagating the errors on the cusp positions.
of the enhancements SU0-5 as a function of VP. The red dotted line represents the mean value. Right panel: dynamical age versus timescale between adjacent cusps (τi − τi+1). The uncertainties are determined by propagating the errors on the cusp positions.
Current usage metrics show cumulative count of Article Views (full-text article views including HTML views, PDF and ePub downloads, according to the available data) and Abstracts Views on Vision4Press platform.
Data correspond to usage on the plateform after 2015. The current usage metrics is available 48-96 hours after online publication and is updated daily on week days.
Initial download of the metrics may take a while.