Fig. 13
Download original image
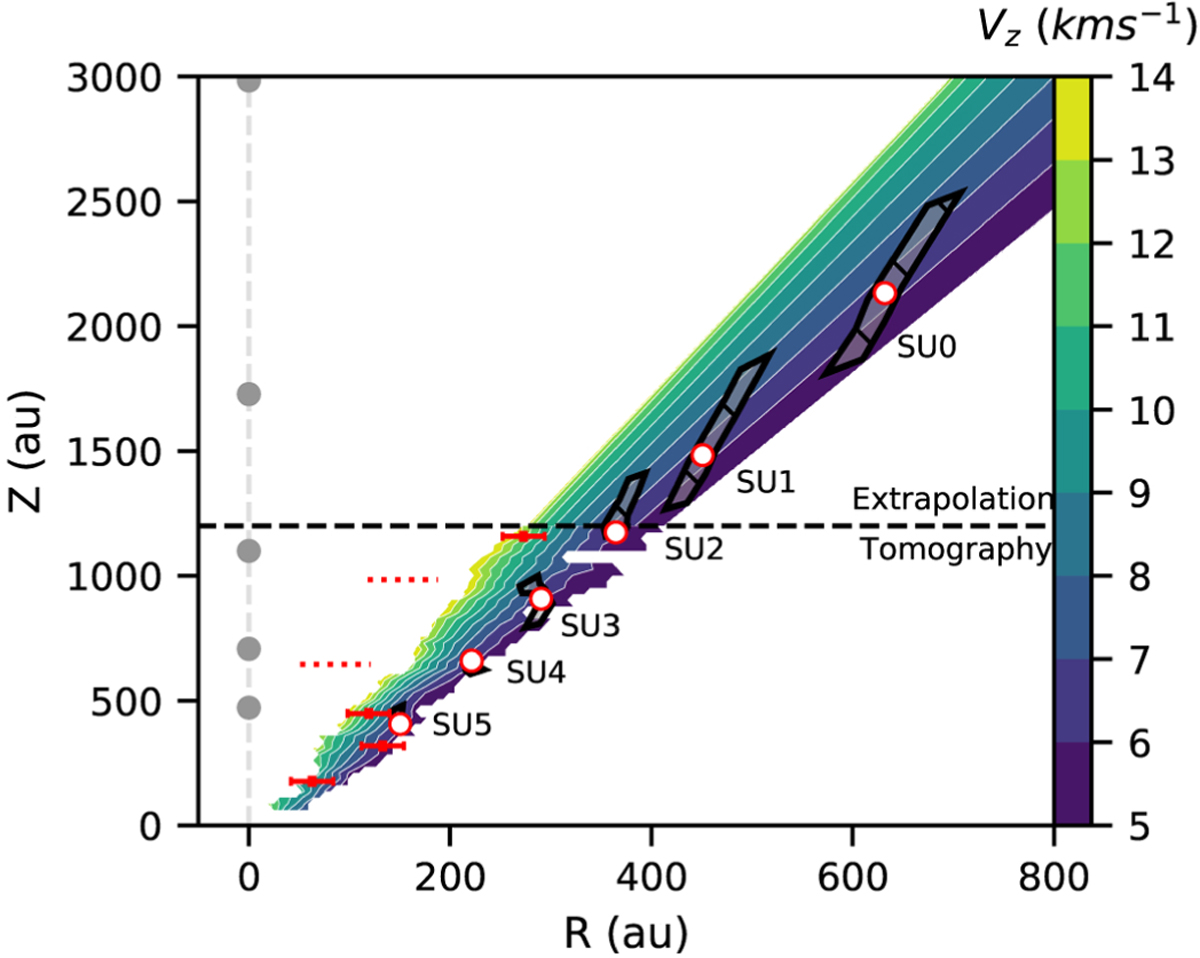
Tomographic map of VZ from Fig. 3 extrapolated from Z = 1200 au to Z = 3000 au using the conical wind model from Fig. 9. Gray hatched regions named SU0-5 represent the locus of emissivity enhancements required to explain the cusps on-axis positions at V − Vsys = 3.73–5.32 km s−1 (see Fig. B.1). White dots represent the solutions for the cusps at V − Vsys = 4.37 km s−1. Red dotted lines indicate the height of the two extrema in specific angular momentum (from Fig. 3). The gray points located on the R = 0 axis represent the positions of jet knots observed by Podio et al. (2011). The red dots indicate the positions with associated errors of the ellipses identified in transverse PV diagrams (see Appendix C) and indicate that emissivity enhancements extend to the inner streamlines.
Current usage metrics show cumulative count of Article Views (full-text article views including HTML views, PDF and ePub downloads, according to the available data) and Abstracts Views on Vision4Press platform.
Data correspond to usage on the plateform after 2015. The current usage metrics is available 48-96 hours after online publication and is updated daily on week days.
Initial download of the metrics may take a while.