Fig. 10
Download original image
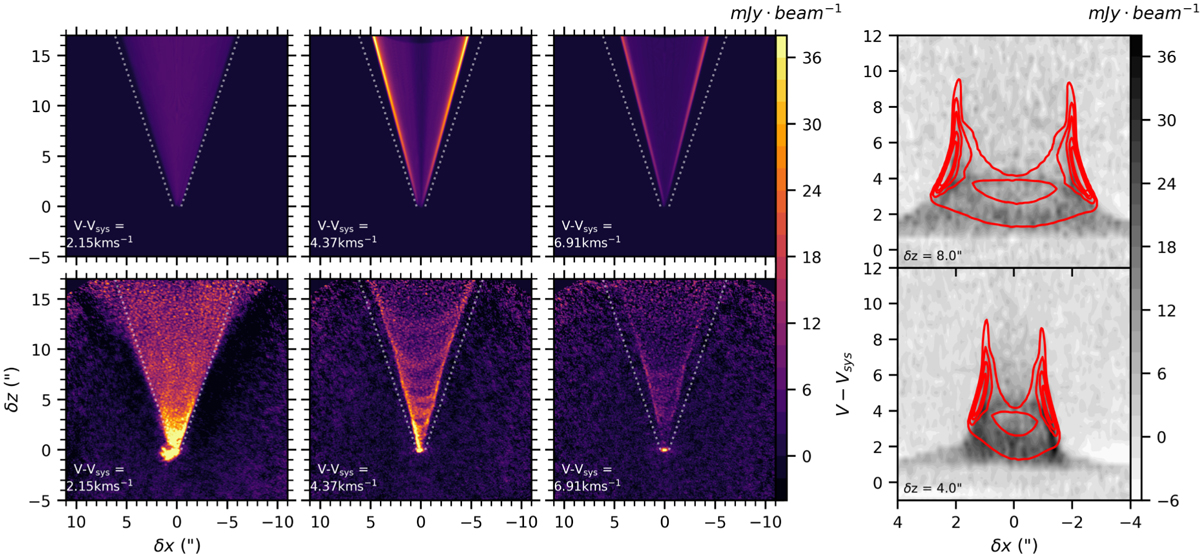
Comparison of observations with steady disk-wind model. Left panels: individual 12CO channel maps computed from the global disk-wind model at selected line-of-sight velocities (top row) are compared to observations (bottom row). The color scale is the same for all the channel maps. Right panels: transverse PV diagrams at two positions δz along the flow and averaged over a slice of width ∆Z = 0.2″. The background grayscale image shows the observations and the red contours trace the predictions from the disk-wind model. (V − Vsys) units are km s−1.
Current usage metrics show cumulative count of Article Views (full-text article views including HTML views, PDF and ePub downloads, according to the available data) and Abstracts Views on Vision4Press platform.
Data correspond to usage on the plateform after 2015. The current usage metrics is available 48-96 hours after online publication and is updated daily on week days.
Initial download of the metrics may take a while.