Fig. 1
Download original image
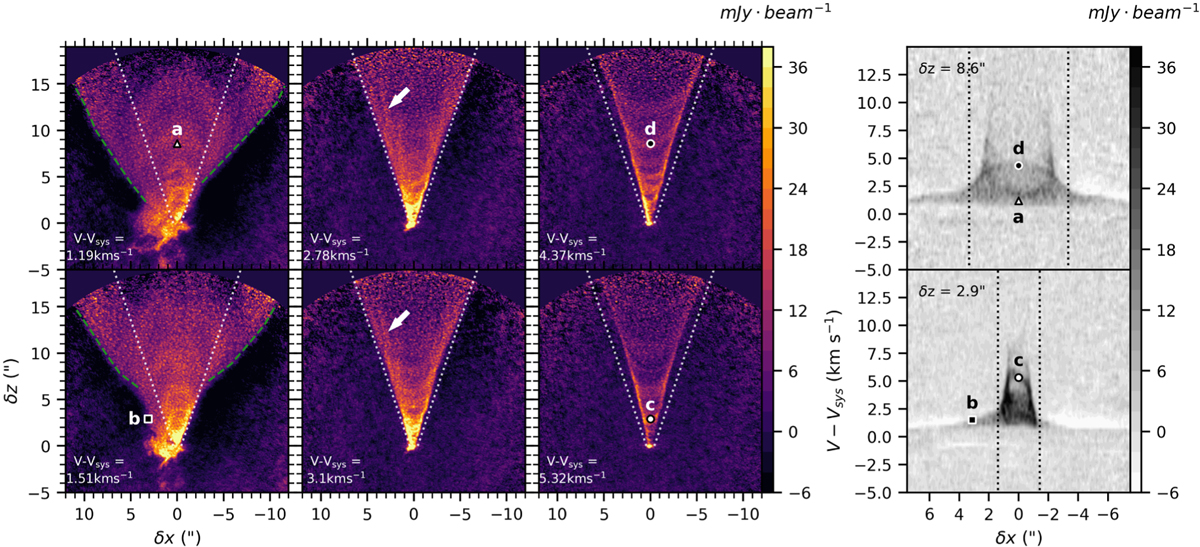
Substructures in the DG Tau B redshifted CO outflow. Left panels: 12CO channel maps at selected line-of-sight velocities. The white dashed line traces the θ = 17° outer limiting cone of the inner outflow as defined by DV20. Right panels: transverse PV diagrams across the flow averaged over a slice of ∆Z = 0.2″. Black dotted lines indicate the outer limits of the conical outflow at the specified height. The triangle (a) and the two circle symbols (c and d) highlight the on-axis height of one arch and two different cusps, respectively. The square symbol (b) is located in the extended outer flow. The symbols are represented both on the channel maps and PV diagrams.
Current usage metrics show cumulative count of Article Views (full-text article views including HTML views, PDF and ePub downloads, according to the available data) and Abstracts Views on Vision4Press platform.
Data correspond to usage on the plateform after 2015. The current usage metrics is available 48-96 hours after online publication and is updated daily on week days.
Initial download of the metrics may take a while.