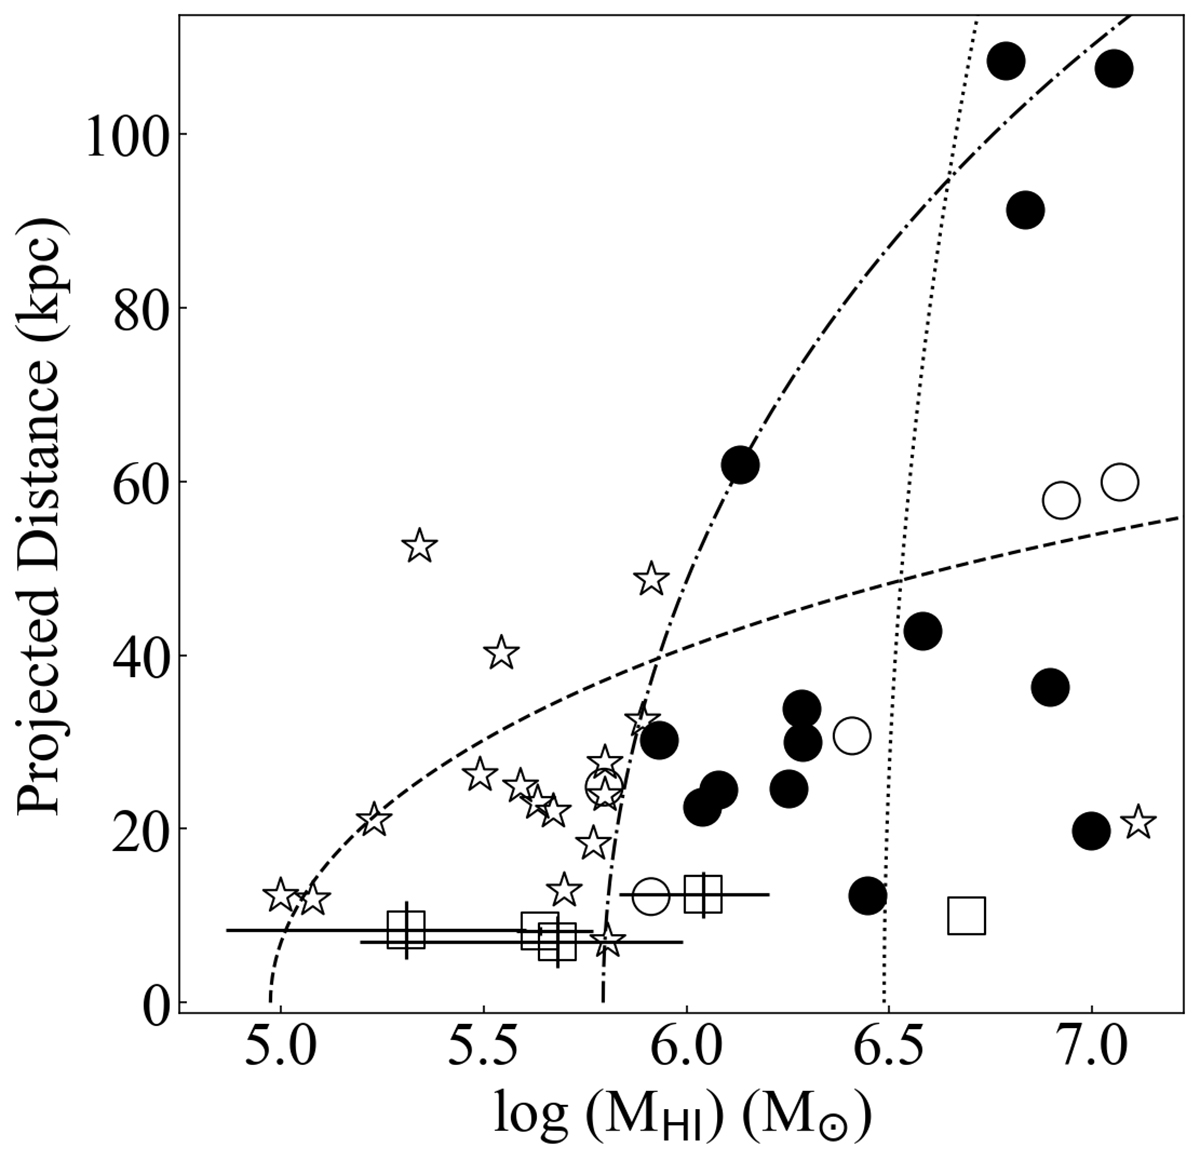
Fig. 7.
Download original image
Mass vs. projected distance to the host for the clouds surrounding M 31 (stars; Westmeier et al. 2008) and our detections. Filled circles show the cloud candidates, and open circles show our detections with a stellar counterpart. Open squares indicate the Milky Way HVC complexes. Their errors indicate the actual observed ranges. The dashed, dot-dashed, and dotted lines indicate the minimum, median, and maximum detection limits in the survey galaxies. The limits are primary beam corrected and hence increase with increased distance to the host. The axes are not adjusted to show the companions, therefore only a few are visible.
Current usage metrics show cumulative count of Article Views (full-text article views including HTML views, PDF and ePub downloads, according to the available data) and Abstracts Views on Vision4Press platform.
Data correspond to usage on the plateform after 2015. The current usage metrics is available 48-96 hours after online publication and is updated daily on week days.
Initial download of the metrics may take a while.