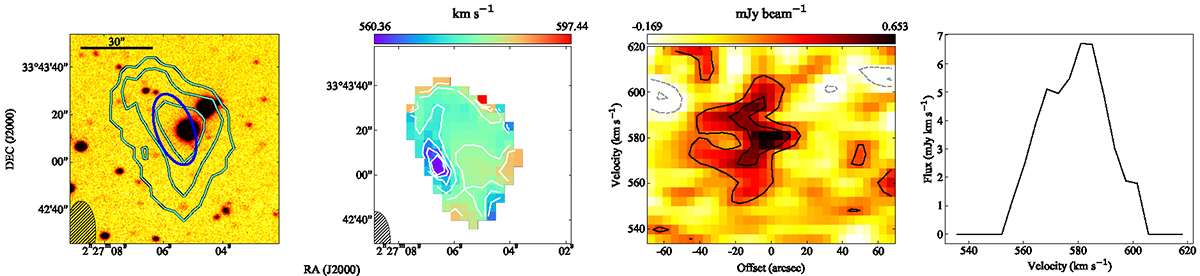
Fig. B.16.
Download original image
Overview panels for source 2 in the cube of NGC 0925. From left to right: Optical image overlaid with contours of the H I moment 0 (intensity) map, moment 1 (velocity ) map, the PV diagram along the major axis, and line profile. Contours for moment 0 are 6.8, 27.2, and 54.4×1018cm−2 overlaid on our HALOSTARS R-band image. They are corrected with the same factor as the integrated flux in the various tables to account for the primary beam response. The blue ellipse indicates the SOF IA fit ellipse. Contours for the velocity field start at 560.36 km s−1 and increase with 5.00 km s−1. The PV diagram is extracted at a PA of 206° with contours at -3, -1.5, 1.5, and 3 σ, with σ = 0.160 mJy beam−1.
Current usage metrics show cumulative count of Article Views (full-text article views including HTML views, PDF and ePub downloads, according to the available data) and Abstracts Views on Vision4Press platform.
Data correspond to usage on the plateform after 2015. The current usage metrics is available 48-96 hours after online publication and is updated daily on week days.
Initial download of the metrics may take a while.