Fig. 2.
Download original image
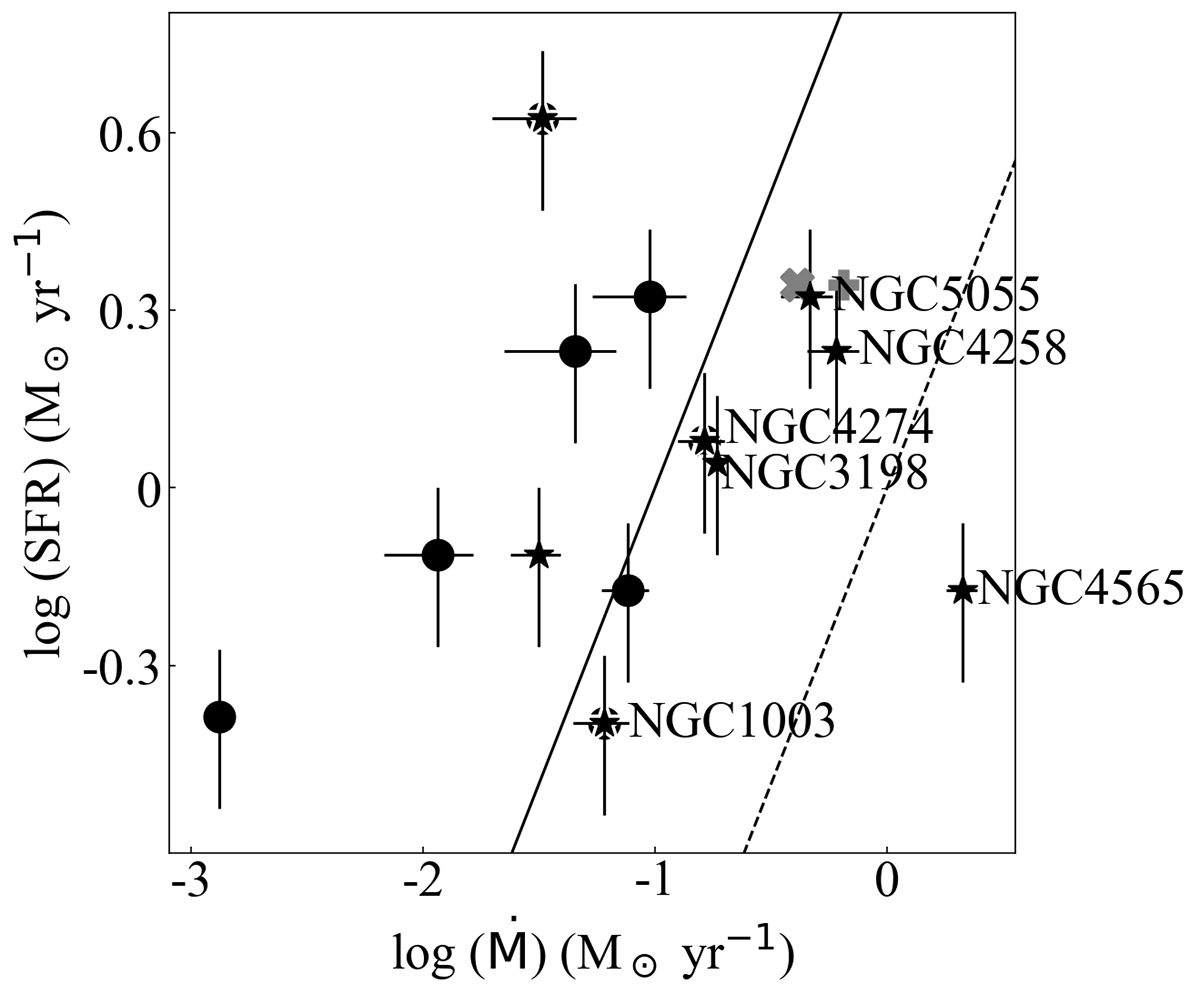
Ṁ vs. SFR of host galaxies. Solid circles represent the average of the two calculated accretion rates, one with a timescale of tff1 (infall on center) and the other with a timescale of tff2 (infall on edge of disk), for galaxies with cloud candidates. The horizontal error indicates the distance to these upper limits. The errors on the SFR indicate the assumed 30% error. Stars show the same, but now for all sources around the target within the virial radius for the whole sample, barring the merging galaxies. The solid line represents Ṁ = 0.1 × SFR (galaxies to the right of this line are labeled with their name) and the dashed line Ṁ = SFR. The gray cross and plus symbol indicate where NGC 891 would fall according to our method and when individual SOF IA detections are not merged with the disk, respectively (see Sect. 5.2).
Current usage metrics show cumulative count of Article Views (full-text article views including HTML views, PDF and ePub downloads, according to the available data) and Abstracts Views on Vision4Press platform.
Data correspond to usage on the plateform after 2015. The current usage metrics is available 48-96 hours after online publication and is updated daily on week days.
Initial download of the metrics may take a while.