Open Access
Fig. 1.
Download original image
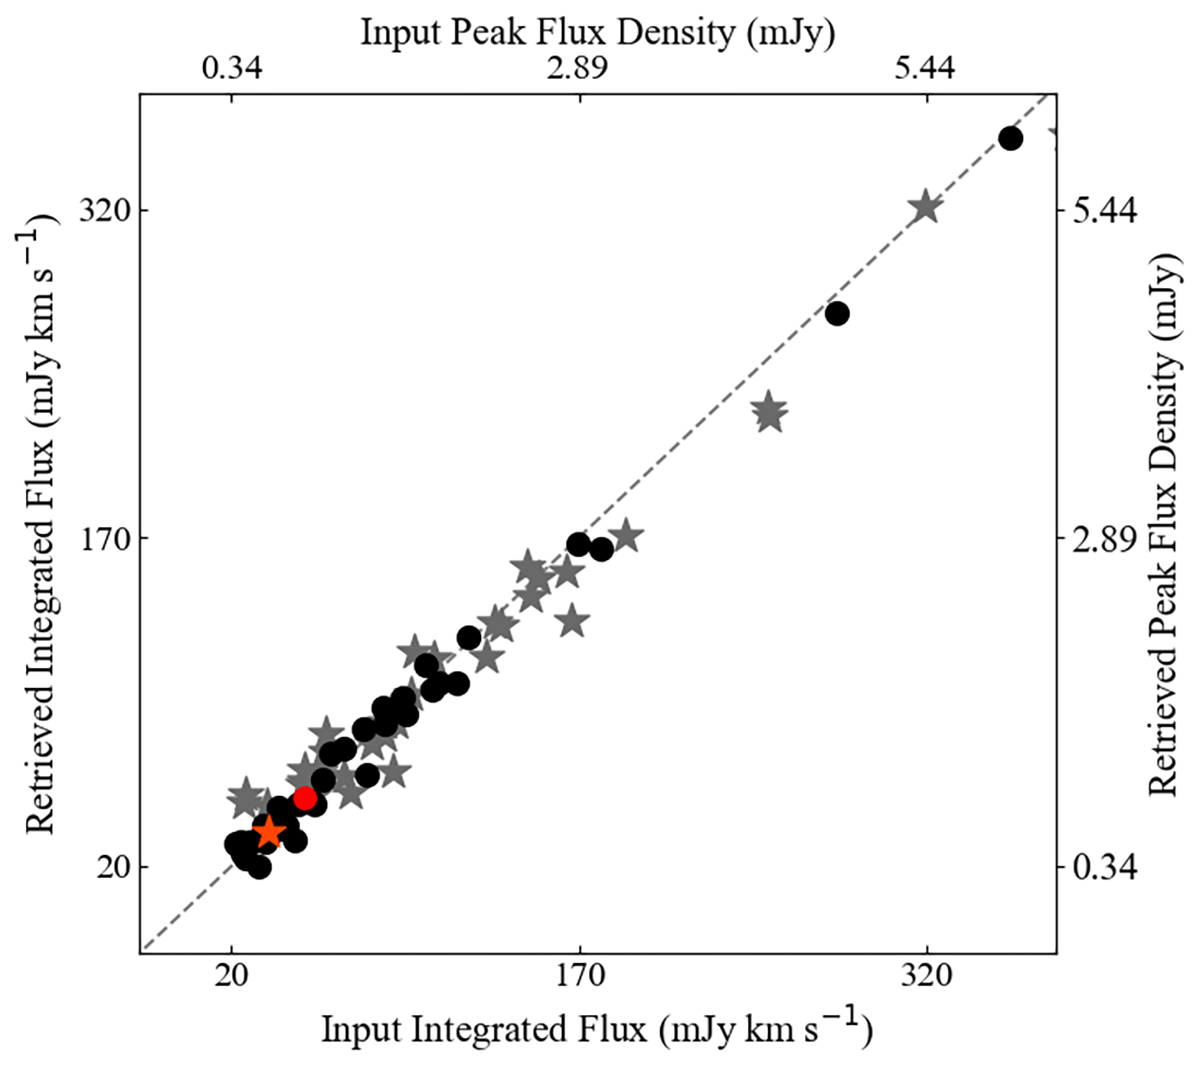
Integrated flux (circles, mJy km s−1, right and bottom axes) and spectral peak flux densities (stars, mJy, left and top axes) from the input catalog vs. SOF IA-retrieved values for the detected sources. Black and gray are the sources detected by SOF IA, red is the false detection.
Current usage metrics show cumulative count of Article Views (full-text article views including HTML views, PDF and ePub downloads, according to the available data) and Abstracts Views on Vision4Press platform.
Data correspond to usage on the plateform after 2015. The current usage metrics is available 48-96 hours after online publication and is updated daily on week days.
Initial download of the metrics may take a while.