Fig. 7
Download original image
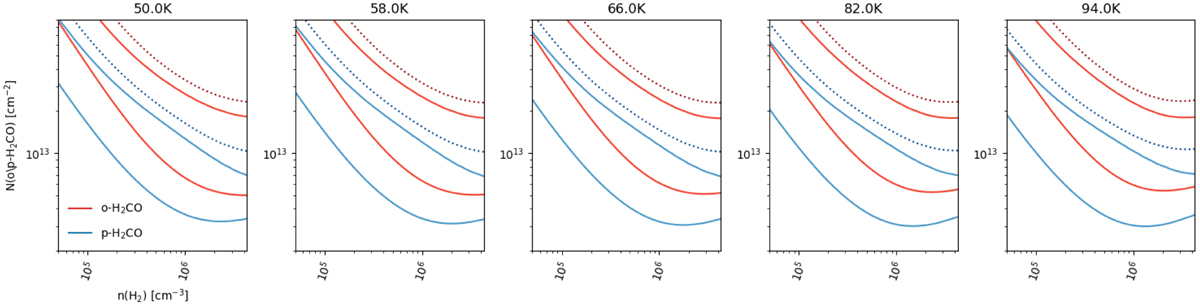
RADEX non-LTE modeling of the line intensity of o- and p-H2CO to probe the column densities of both species. Each panel corresponds to a slice of constant Tkin from a 3D grid of ![]() (see Appendix C). Red contours are for o-H2CO, while blue ones are for p-H2CO. The solid and dotted contours are represented by 99.7 and 99.99% that the observed intensity inside the modeled contours (or
(see Appendix C). Red contours are for o-H2CO, while blue ones are for p-H2CO. The solid and dotted contours are represented by 99.7 and 99.99% that the observed intensity inside the modeled contours (or ![]() and 25), respectively.
and 25), respectively.
Current usage metrics show cumulative count of Article Views (full-text article views including HTML views, PDF and ePub downloads, according to the available data) and Abstracts Views on Vision4Press platform.
Data correspond to usage on the plateform after 2015. The current usage metrics is available 48-96 hours after online publication and is updated daily on week days.
Initial download of the metrics may take a while.