Fig. 6
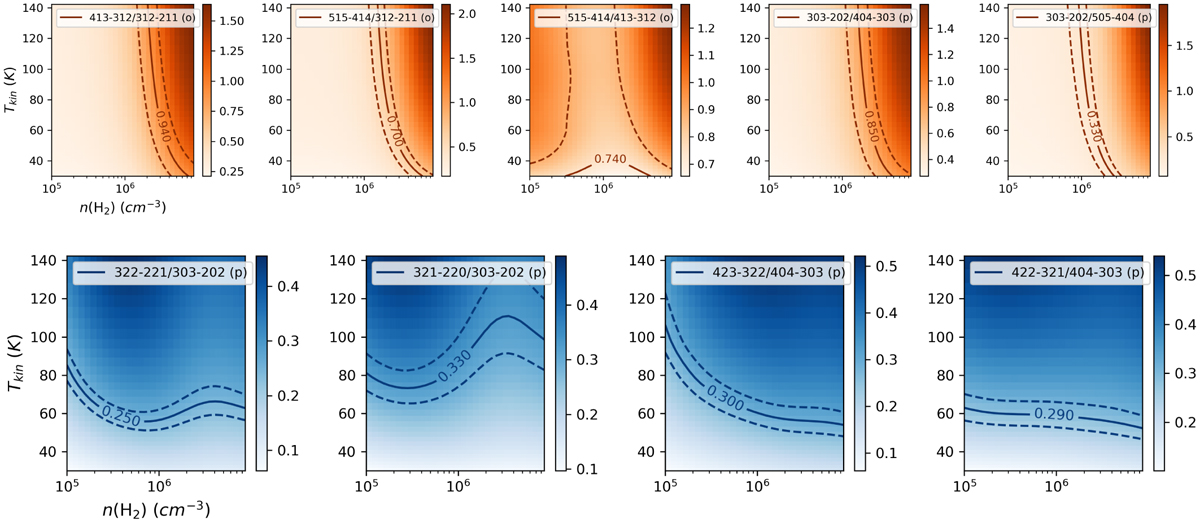
Download original image
RADEX non-LTE modeling of the H2CO line ratios to probe H2 spatial-density (top) and kinetic temperature (bottom). The background color shows the modeled ratios on the density and temperature grid. Solid lines are the contours of modeled ratios corresponding to the observed values and dashed lines correspond to the uncertainties. Adopted value of column density for these contours is N = 1013 cm−2. The effects of optical depths were monitored during the modeling and they are smaller than 0.3 and hence do not effect the results significantly.
Current usage metrics show cumulative count of Article Views (full-text article views including HTML views, PDF and ePub downloads, according to the available data) and Abstracts Views on Vision4Press platform.
Data correspond to usage on the plateform after 2015. The current usage metrics is available 48-96 hours after online publication and is updated daily on week days.
Initial download of the metrics may take a while.