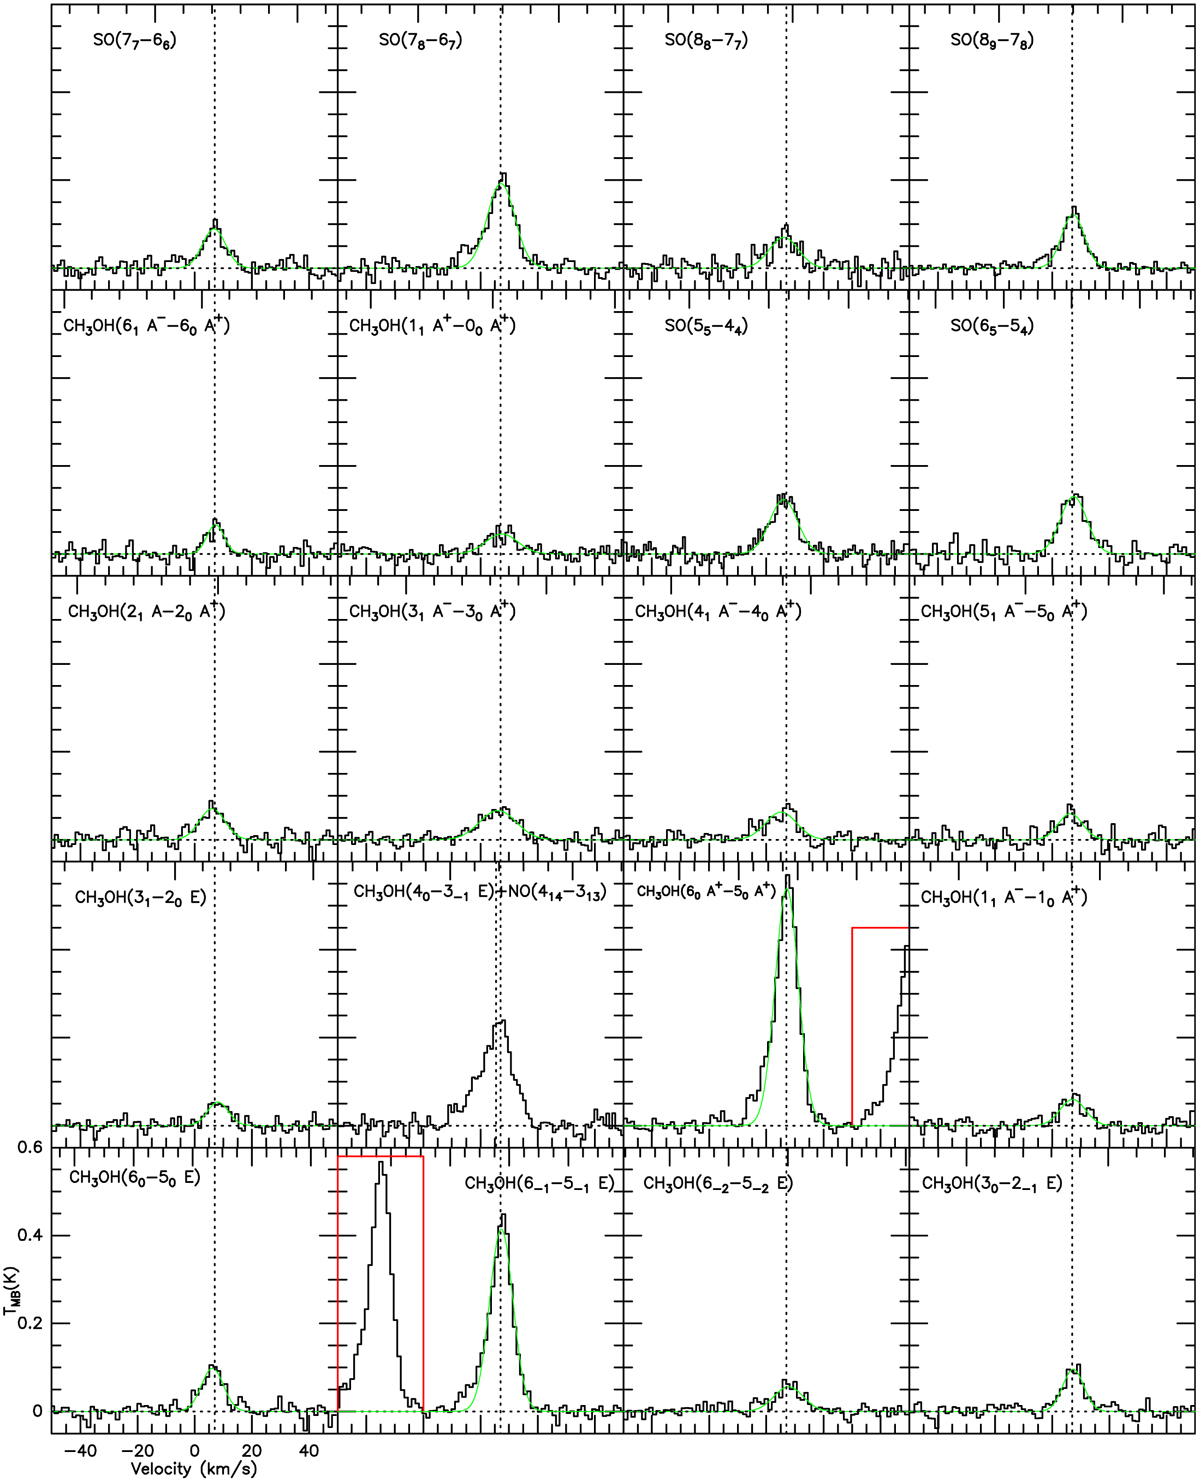
Fig. 3
Download original image
Spectra of the observed species in W28 F. The intensity is in the TMB scale. The LSR velocity scale in km s−1, is appropriate for the line listed in the upper left corner of each panel, except for cases in which more than one line is shown, which are explicitly labelled. Lines marked with red lines are not labelled in the shown window. All the spectra have been smoothed to a velocity resolution of ≈1 km s−1. Single Gaussian fits are shown as green lines overlaid on the spectra. Dashed vertical lines are at an LSR velocity of 7 km s−1 for the labeled lines.
Current usage metrics show cumulative count of Article Views (full-text article views including HTML views, PDF and ePub downloads, according to the available data) and Abstracts Views on Vision4Press platform.
Data correspond to usage on the plateform after 2015. The current usage metrics is available 48-96 hours after online publication and is updated daily on week days.
Initial download of the metrics may take a while.