Fig. 2
Download original image
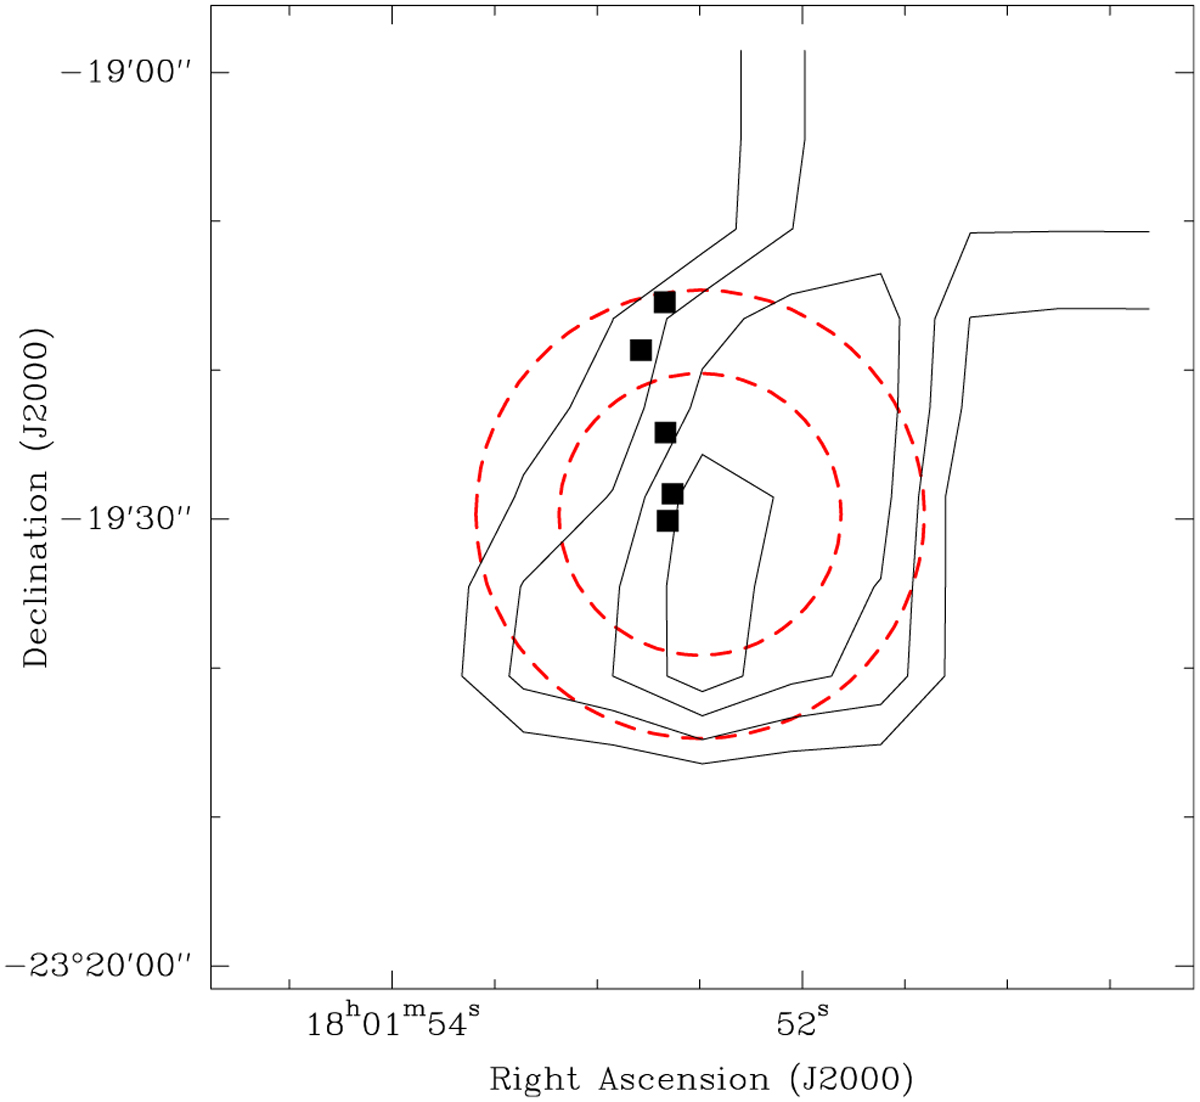
W28 F: map of the main-beam brightness temperature of the CH3OH (J = 60–50 A+) transition integrated over the LSR velocity range from −10 to 25 km s−1. The contour values are at three, five, seven and nine times the rms noise level, which is 0.36 K km s−1. Overlaid we have the OH maser positions (black filled squares) from Claussen et al. (1997) that are located inside the field of view. The large and small circles (30″ and 16″ diameter) represent the FWHM beam width of the APEX telescope at our lowest and highest observing frequency (213 and 374 GHz, respectively). The beams are centered on the methanol peak position (see text) toward which we performed our long integrations.
Current usage metrics show cumulative count of Article Views (full-text article views including HTML views, PDF and ePub downloads, according to the available data) and Abstracts Views on Vision4Press platform.
Data correspond to usage on the plateform after 2015. The current usage metrics is available 48-96 hours after online publication and is updated daily on week days.
Initial download of the metrics may take a while.