Fig. D.1
Download original image
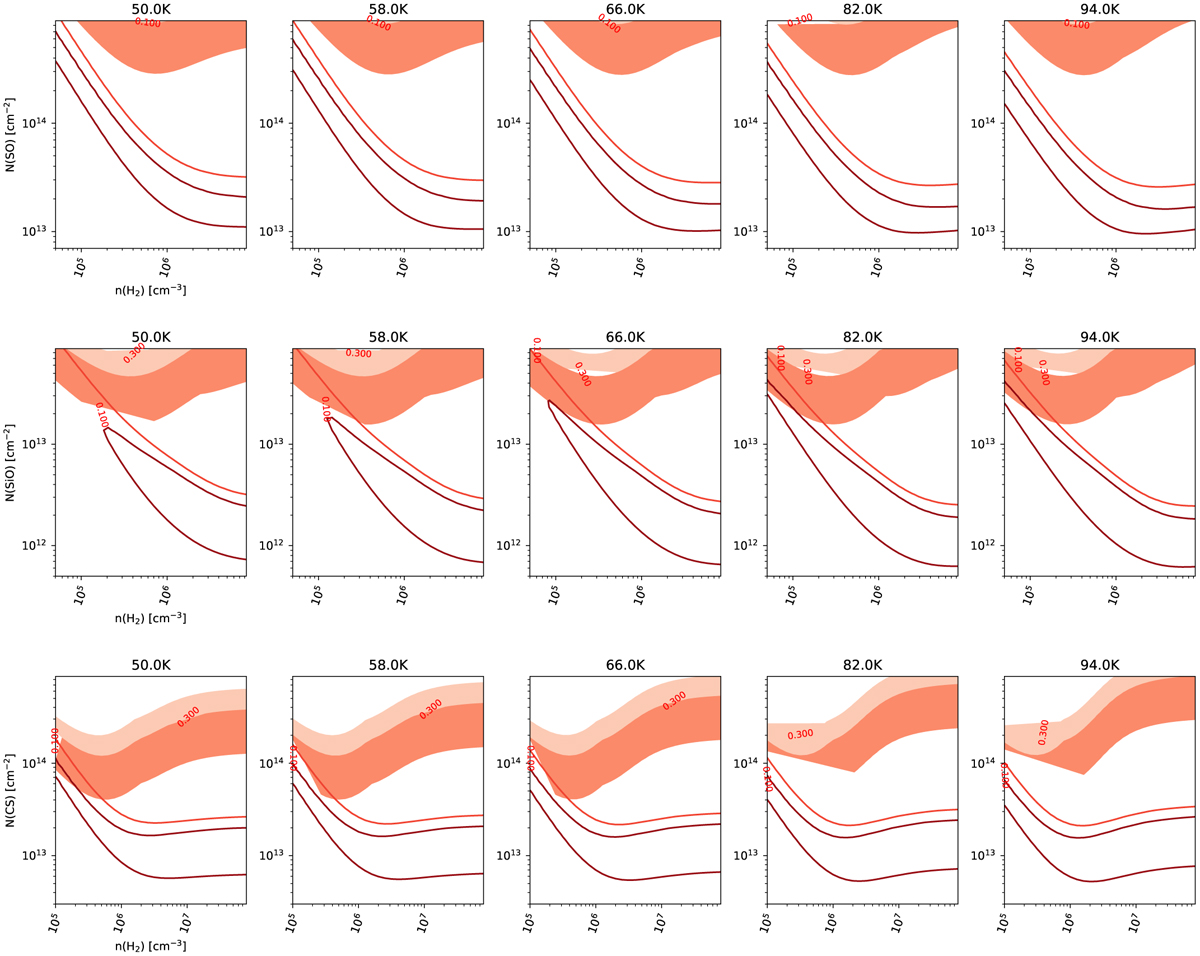
2D constant Tkin slices from a 3 dimensional grid of ![]() for SO (top), SiO (middle) and CS (bottom). Contours of constant
for SO (top), SiO (middle) and CS (bottom). Contours of constant ![]() (darker); 25 (lighter) on a column density vs. H2 density grid for detected lines are shown. The background shades show the optical depths τ = 0.05 (darker region) and 0.1 (lighter region) for all species. These optical depths correspond to the maximum optical depth out of all the lines modeled.
(darker); 25 (lighter) on a column density vs. H2 density grid for detected lines are shown. The background shades show the optical depths τ = 0.05 (darker region) and 0.1 (lighter region) for all species. These optical depths correspond to the maximum optical depth out of all the lines modeled.
Current usage metrics show cumulative count of Article Views (full-text article views including HTML views, PDF and ePub downloads, according to the available data) and Abstracts Views on Vision4Press platform.
Data correspond to usage on the plateform after 2015. The current usage metrics is available 48-96 hours after online publication and is updated daily on week days.
Initial download of the metrics may take a while.