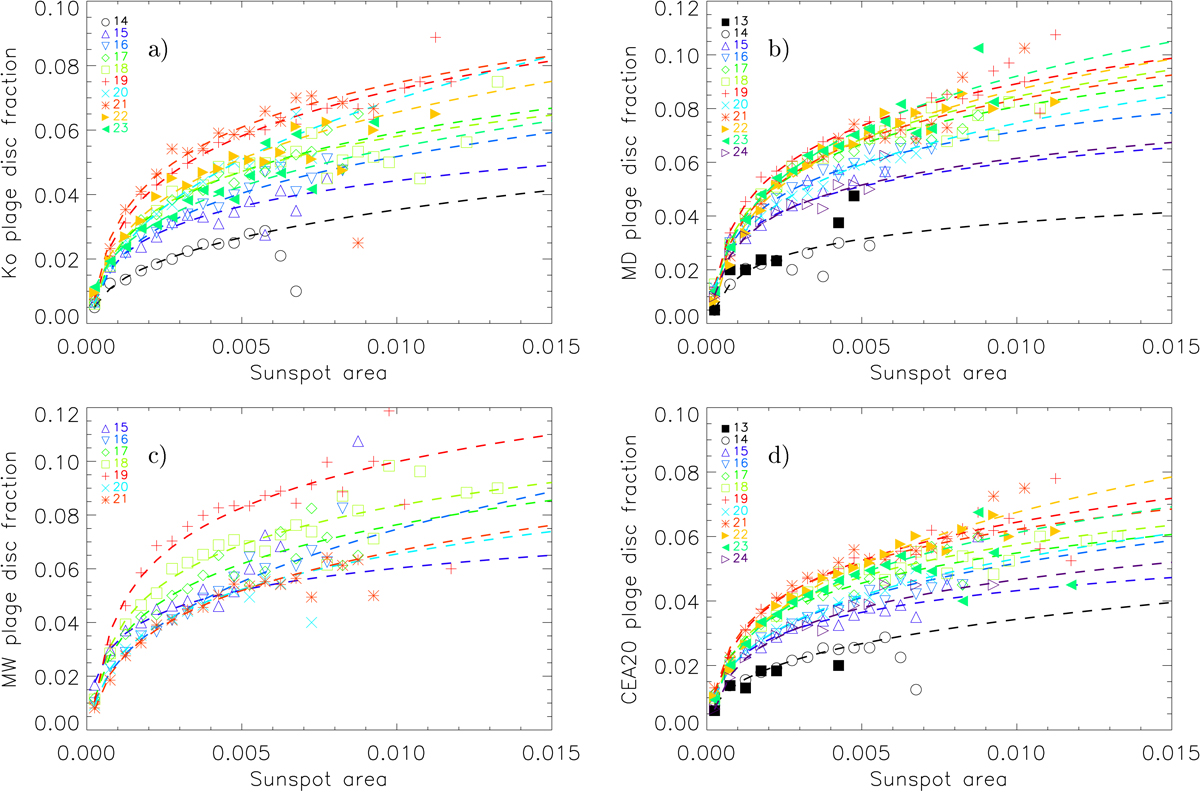
Fig. A.1.
Download original image
Relation between plage and sunspot areas for individual SC based on the data from the Ko (a), MD (b), and MW (c) archives, and from the CEA20 plage area composite (d). The symbols denote the mean values of the PDF matrices (as shown in Fig. 3). The dashed lines are power-law fits and are coloured according to the strength of the SC with the strength increasing from black for the weakest cycle, via dark blue, turquise, green, lime, orange, bright red to dark red for the strongest SC.
Current usage metrics show cumulative count of Article Views (full-text article views including HTML views, PDF and ePub downloads, according to the available data) and Abstracts Views on Vision4Press platform.
Data correspond to usage on the plateform after 2015. The current usage metrics is available 48-96 hours after online publication and is updated daily on week days.
Initial download of the metrics may take a while.