Fig. 7.
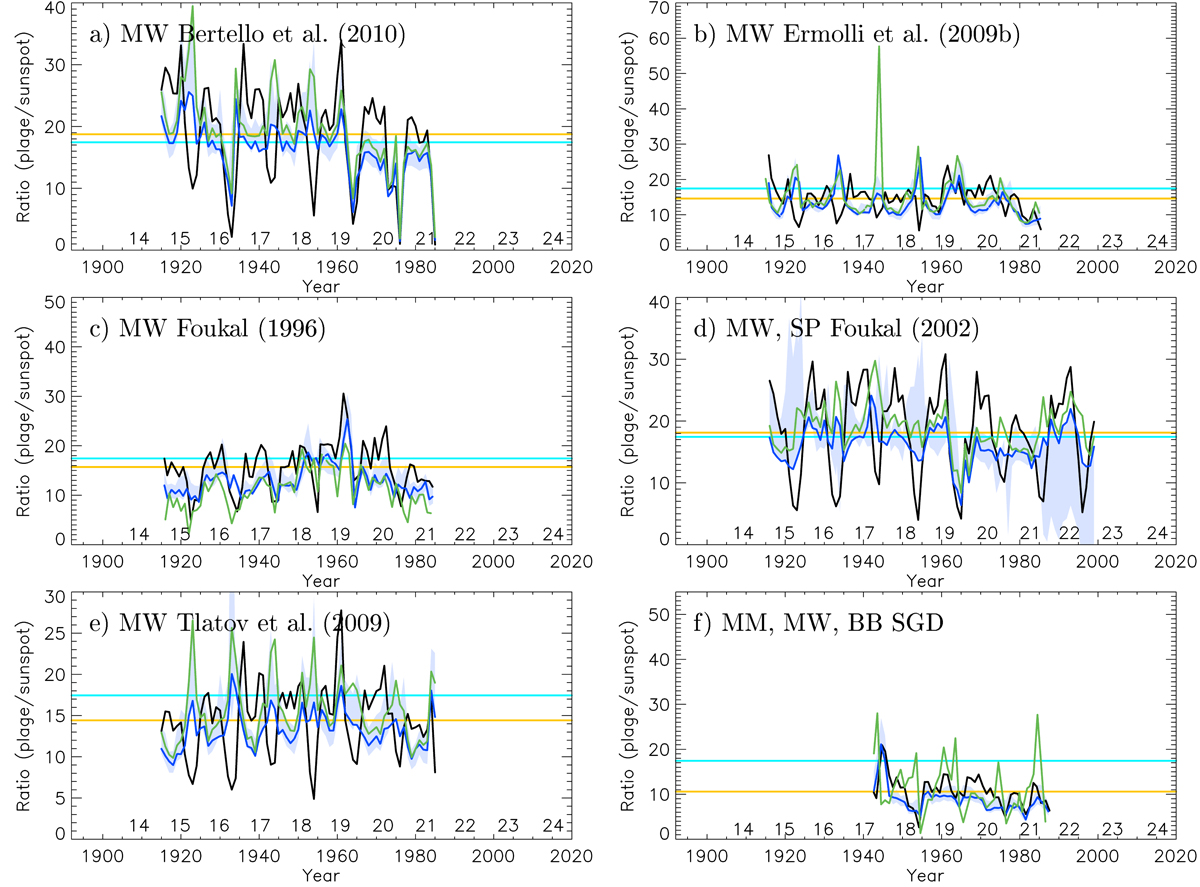
Download original image
Same as Fig. 6, but for the plage area series for MW data by Bertello et al. (2010, a); MW data by Ermolli et al.(2009b, b); MW data by Foukal(1996, c); MW and SP data by Foukal(2002, d); MW data by Tlatov et al. (2009, e); and for MM, MW, and BB data by SGD (f);. The series in panels b, c, and f have daily values, while the others only have annual mean values. The Bertello et al. (2010) series, which is a Ca II K emission index series, was linearly scaled to match the plage areas from our MW data (see Sect. 2).
Current usage metrics show cumulative count of Article Views (full-text article views including HTML views, PDF and ePub downloads, according to the available data) and Abstracts Views on Vision4Press platform.
Data correspond to usage on the plateform after 2015. The current usage metrics is available 48-96 hours after online publication and is updated daily on week days.
Initial download of the metrics may take a while.