Fig. 6.
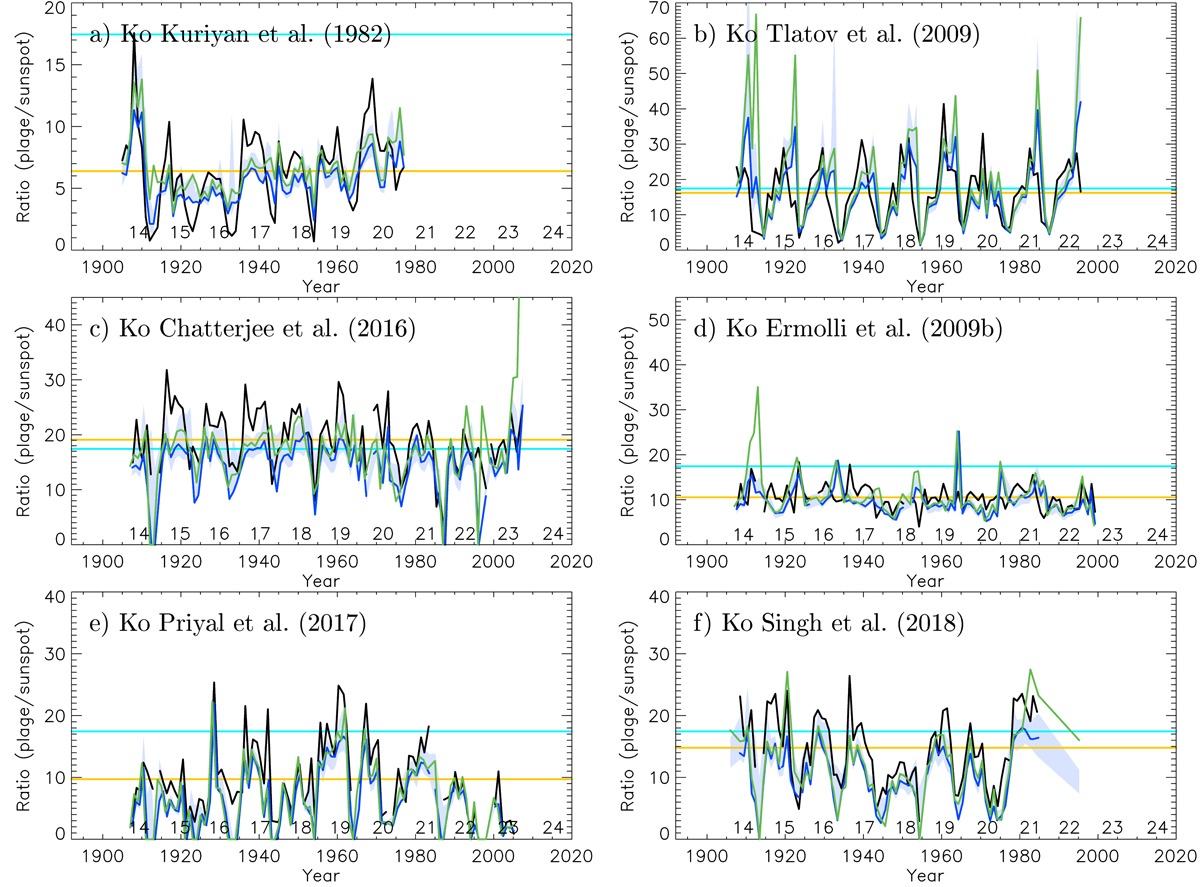
Download original image
Ratio of published plage area series to the sunspot area composite by MEA20 (black), and the group sunspot number series by CEA17 (blue) and SvSc16 (green). The plage area series shown are those for the Ko data by Kuriyan et al. (1982, a), Tlatov et al. (2009, b), Chatterjee et al. (2016, c), Ermolli et al. (2009b, d), Priyal et al. (2017, e), and Singh et al. (2018, f). The first two series provide only annual mean values, while the others have daily cadence. The ratios to the group sunspot number series have been multiplied by 2000 to be plotted alongside the ratios to the sunspot areas. The solid lines are annual median values. The blue shaded area denotes the range of annual values for the ratios from all the sunspot number series used in this study (see Sect. 2). The ratios for the series with daily values are calculated only for the days when the plage areas are greater than 0.0005 in disc fraction. The yellow (light blue) horizontal line represents the average ratio value between the MEA20 sunspot areas and the corresponding plage series (the CEA20 composite plage area series). The numbers at the bottom of each panel denote the conventional SC numbering, and are placed at SC maximum periods.
Current usage metrics show cumulative count of Article Views (full-text article views including HTML views, PDF and ePub downloads, according to the available data) and Abstracts Views on Vision4Press platform.
Data correspond to usage on the plateform after 2015. The current usage metrics is available 48-96 hours after online publication and is updated daily on week days.
Initial download of the metrics may take a while.