Fig. 4.
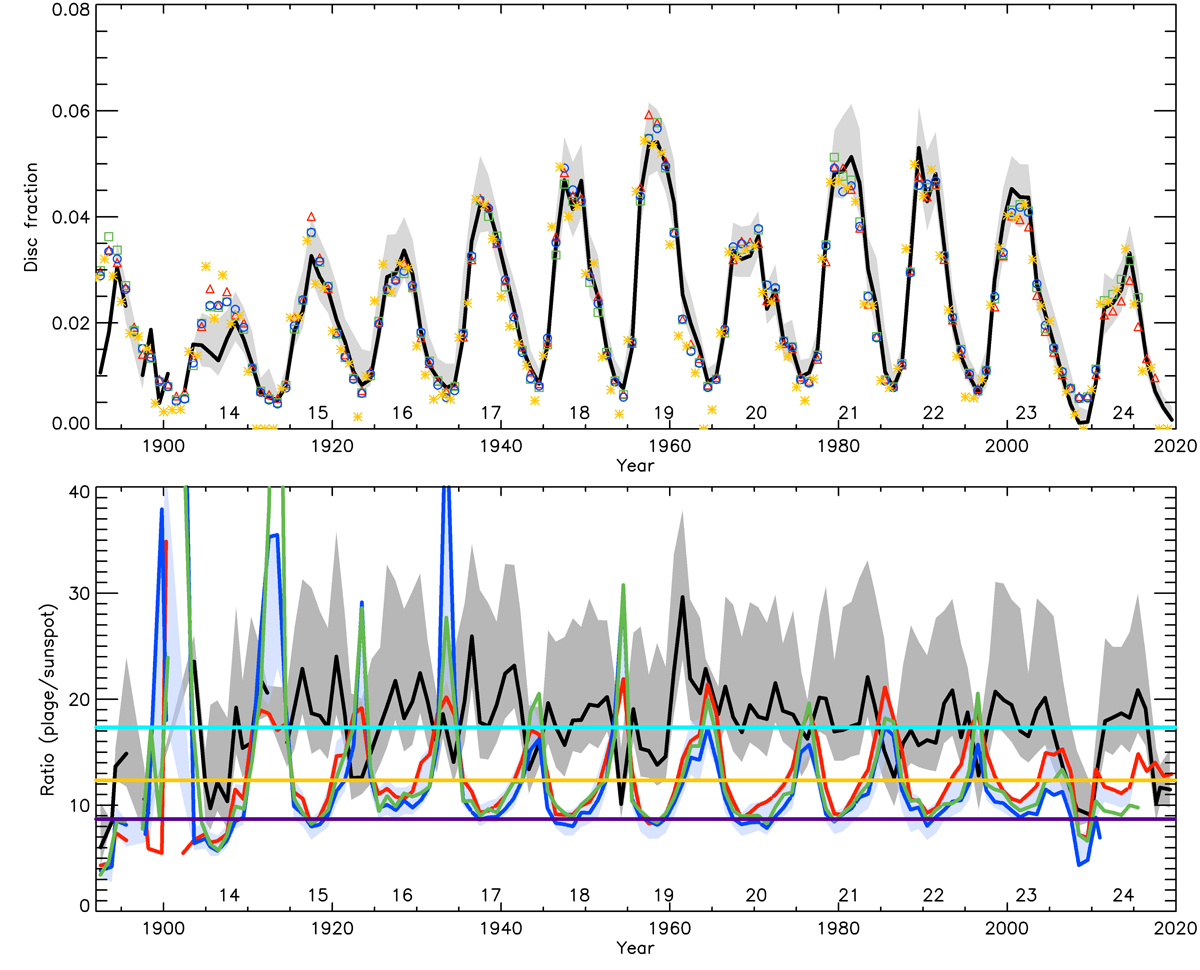
Download original image
Upper panel: CEA20 plage area composite (black line) along with scaled sunspot series by MEA20 (yellow asterisks), CEA17 (blue circles), ISNv2 (red triangles), and SvSc16 (green squares). All series are scaled linearly to the plage areas except MEA20, which is scaled with a square-root function. The solid lines are annual median values, while the grey shaded surface is the asymmetric 1σ interval. Lower panel: ratio of the CEA20 plage areas composite to the sunspot area series by MEA20 (black) and sunspot number series by CEA17 (blue), SvSc16 (green), and ISNv2 (red) as a function of time. The ratios to the GSN series have been multiplied by 2000 to allow a direct comparison with the ratios to the sunspot areas. The blue shaded surface gives the range of annual values for the plage areas to sunspot number ratios from all sunspot number series used in this study. The ratios are calculated only for the days on which sunspot areas are greater than 0.0005 of the disc area or the sunspot number is greater than 0. The yellow (light blue) horizontal line indicates the mean ratio of plage areas to sunspot numbers (sunspot areas), while the purple horizontal line is the mean ratio for the plage areas to sunspot number series over four-year intervals around cycle maxima. The numbers below the curves in each panel denote the conventional SC numbering and are placed at times of SC maxima.
Current usage metrics show cumulative count of Article Views (full-text article views including HTML views, PDF and ePub downloads, according to the available data) and Abstracts Views on Vision4Press platform.
Data correspond to usage on the plateform after 2015. The current usage metrics is available 48-96 hours after online publication and is updated daily on week days.
Initial download of the metrics may take a while.