Open Access
Fig. 3.
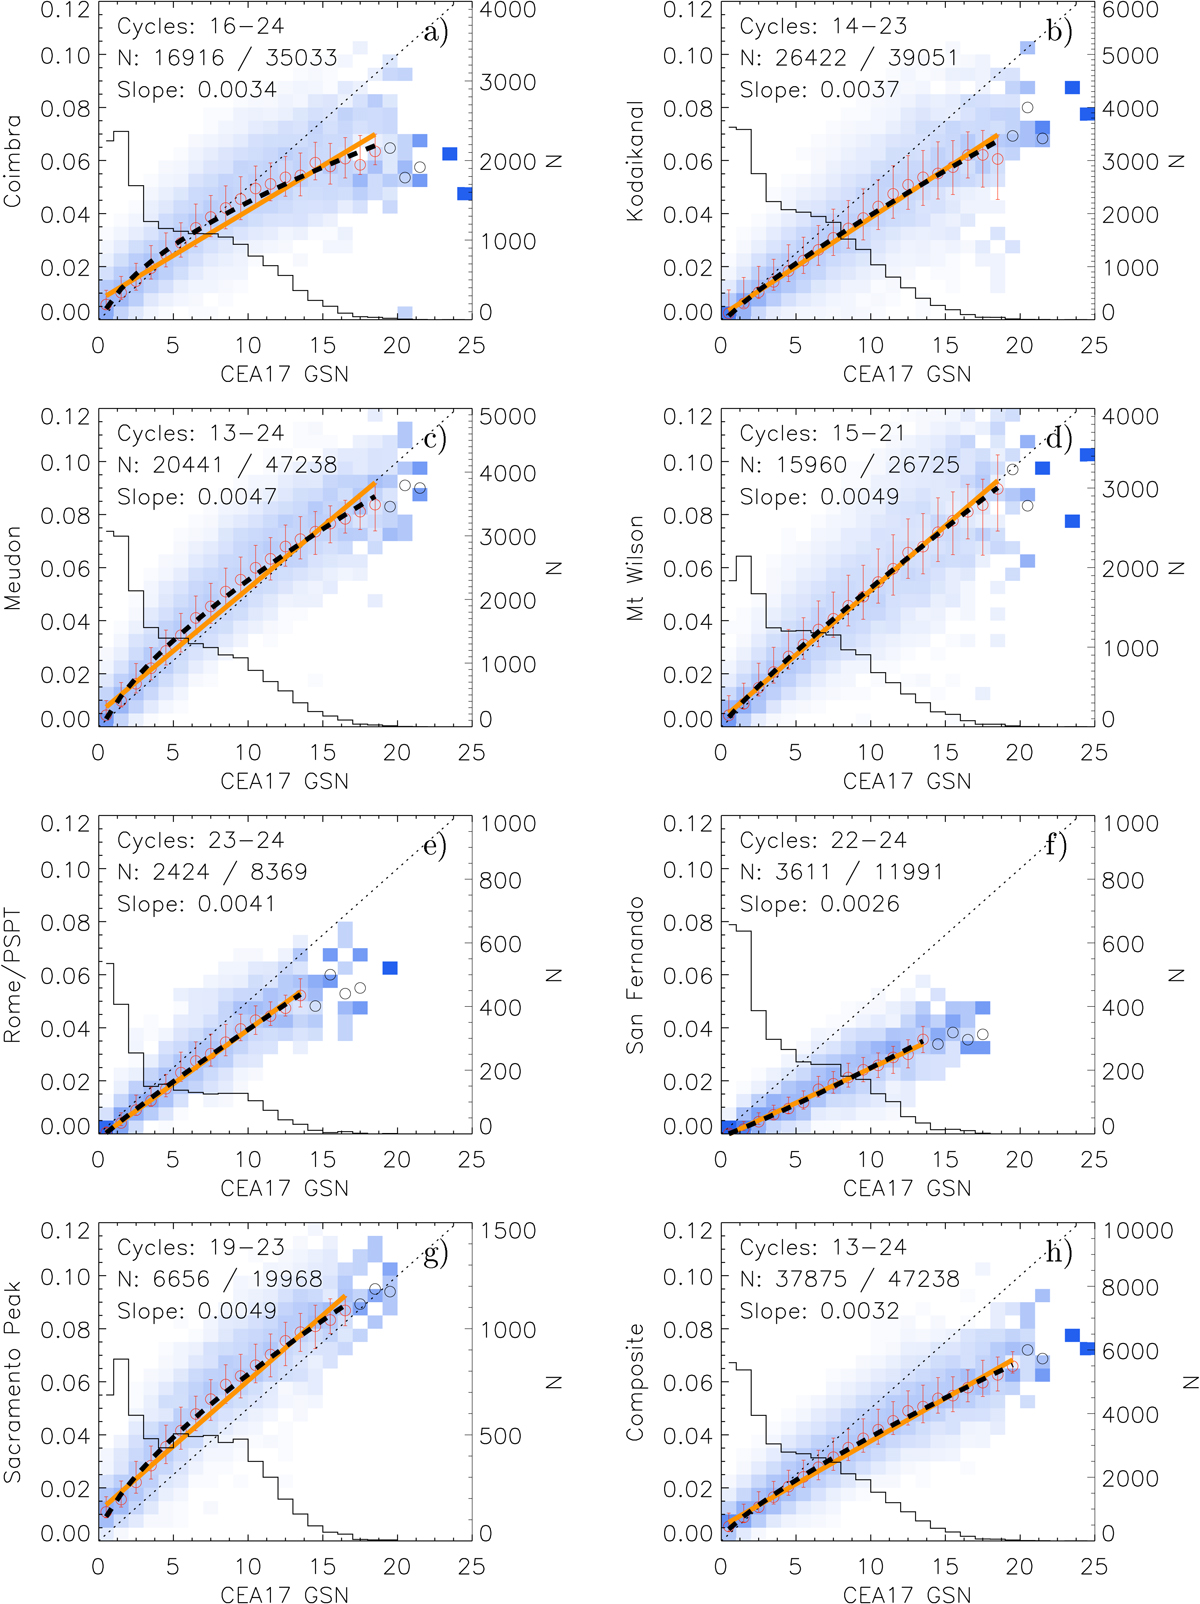
Download original image
Same as Fig. 1, but for the CEA17 GSN series. A linear fit (orange) and a power-law fit (black dashed) were performed to the mean values of each column. The slope of the linear fit is also listed in each panel. The black dotted line has a slope of 0.005.
Current usage metrics show cumulative count of Article Views (full-text article views including HTML views, PDF and ePub downloads, according to the available data) and Abstracts Views on Vision4Press platform.
Data correspond to usage on the plateform after 2015. The current usage metrics is available 48-96 hours after online publication and is updated daily on week days.
Initial download of the metrics may take a while.