Fig. 2.
Download original image
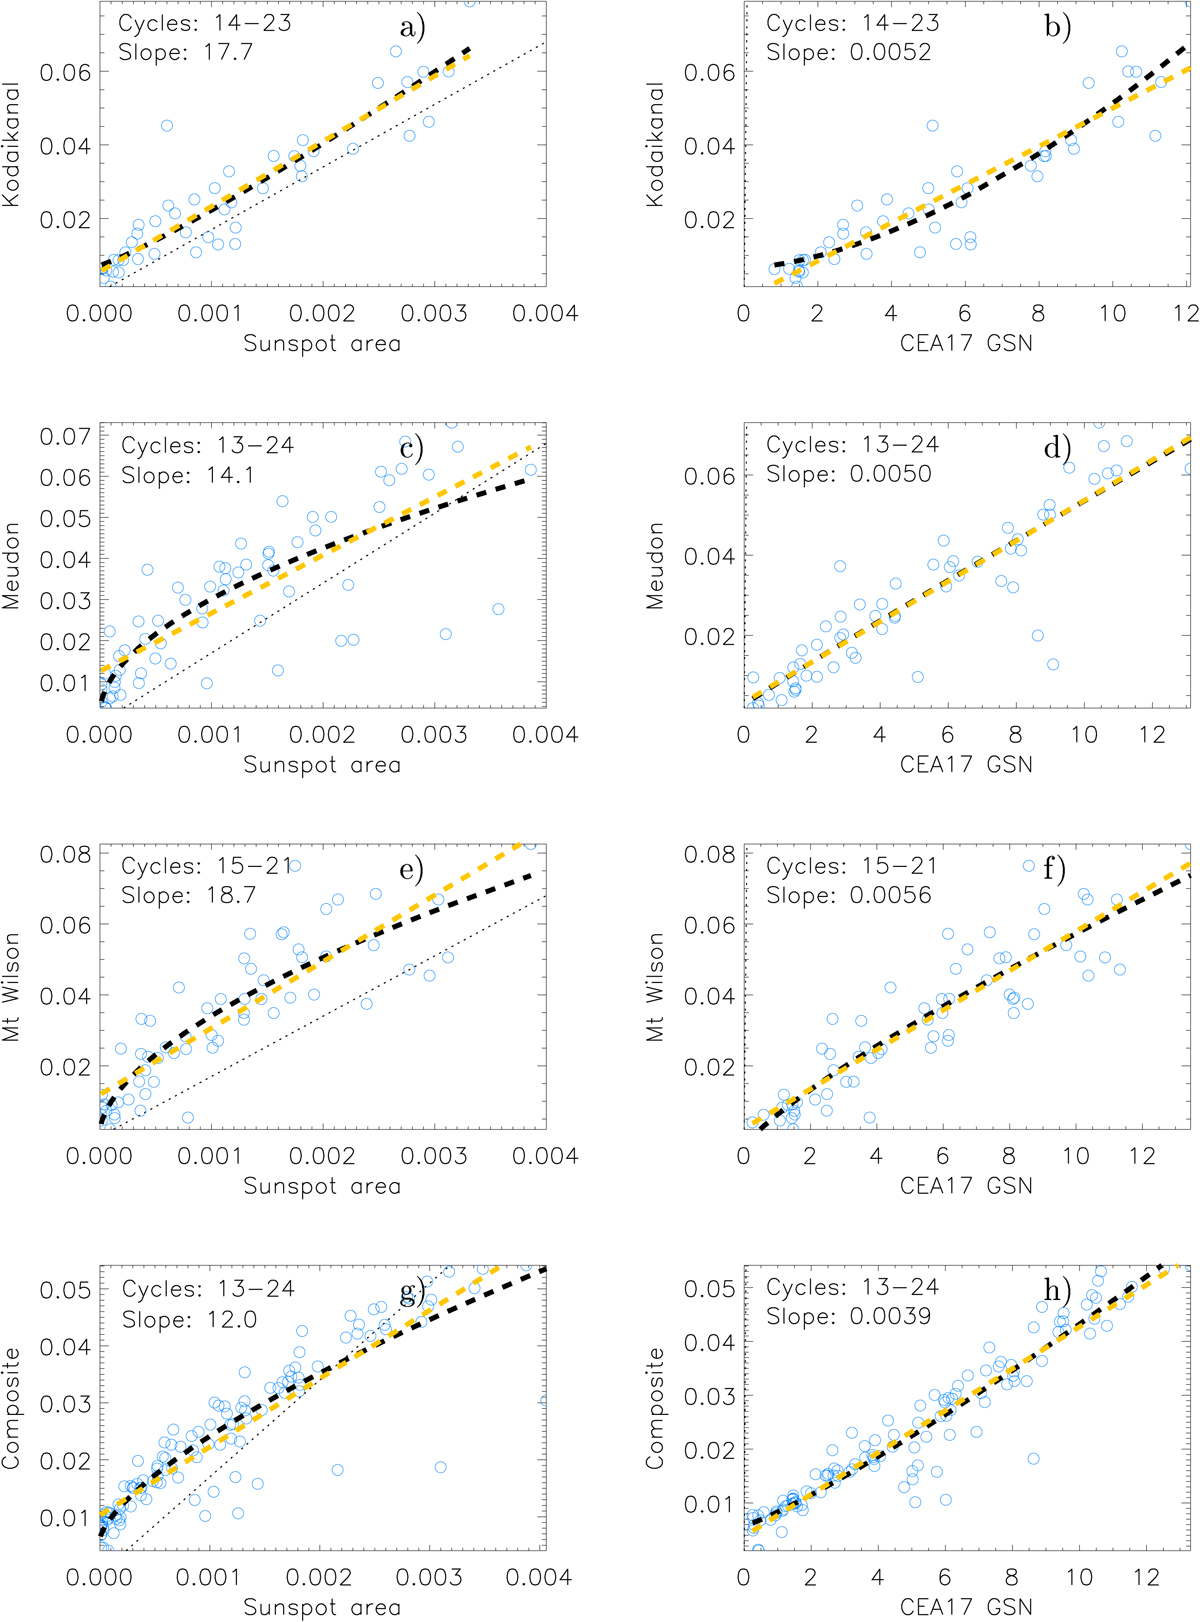
Scatter plots between annual plage fractional areas and the annual MEA20 sunspot fractional areas (left columns) and the annual CEA17 GSN series (right columns). Two different fits are overplotted, a power-law (black) and a linear (yellow) fit. The dotted line has a slope of 17, which corresponds to the mean ratio between the CEA20 plage area series and the MEA19 sunspot area series (see Sect. 3.1). The period of overlap between the two archives (expressed in solar cycles) as well as the slope of the linear fit are shown in each panel.
Current usage metrics show cumulative count of Article Views (full-text article views including HTML views, PDF and ePub downloads, according to the available data) and Abstracts Views on Vision4Press platform.
Data correspond to usage on the plateform after 2015. The current usage metrics is available 48-96 hours after online publication and is updated daily on week days.
Initial download of the metrics may take a while.