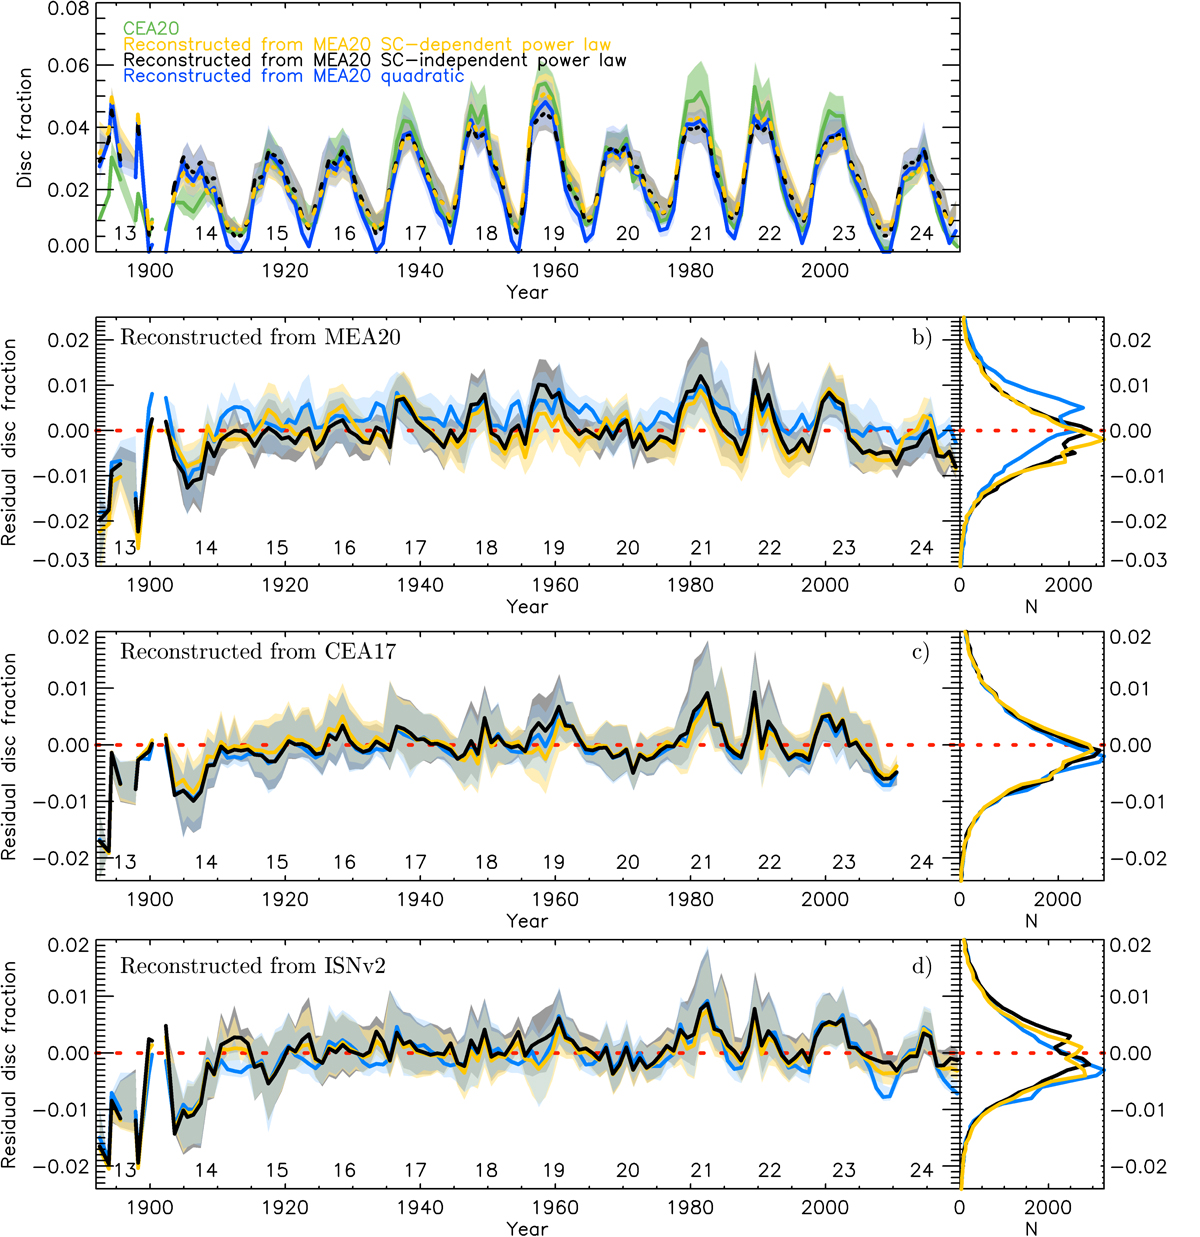
Fig. C.1.
Download original image
Comparison of reconstructed plage areas from sunspot areas using different relationships. Panel a: Reconstructed plage areas from sunspot data and from the CEA20 plage area composite. Shown are annual median values (solid lines) along with the asymmetric 1σ intervals (shaded surfaces). The numbers below the curves denote the conventional SC numbering and are placed at SC maximum periods. Panels b–d Left: Residual areas in fractions of the disc between the CEA20 plage area composite and the plage areas reconstructed from the MEA20 sunspot areas (top panels), the CEA17 GSN series (middle panels), and the ISNv2 series (bottom panels). The reconstructions were produced with a simple linear scaling (blue, only for CEA17 GSN and ISNv2), with a square-root function (blue, only for the MEA20 sunspot areas), with a power-law function (black), and a power-law function with SC-dependent exponents (orange). The red dashed line denotes 0 plage area differences. Panels b–d Right: Distributions of the differences in bins of 0.001 in fractional areas.
Current usage metrics show cumulative count of Article Views (full-text article views including HTML views, PDF and ePub downloads, according to the available data) and Abstracts Views on Vision4Press platform.
Data correspond to usage on the plateform after 2015. The current usage metrics is available 48-96 hours after online publication and is updated daily on week days.
Initial download of the metrics may take a while.