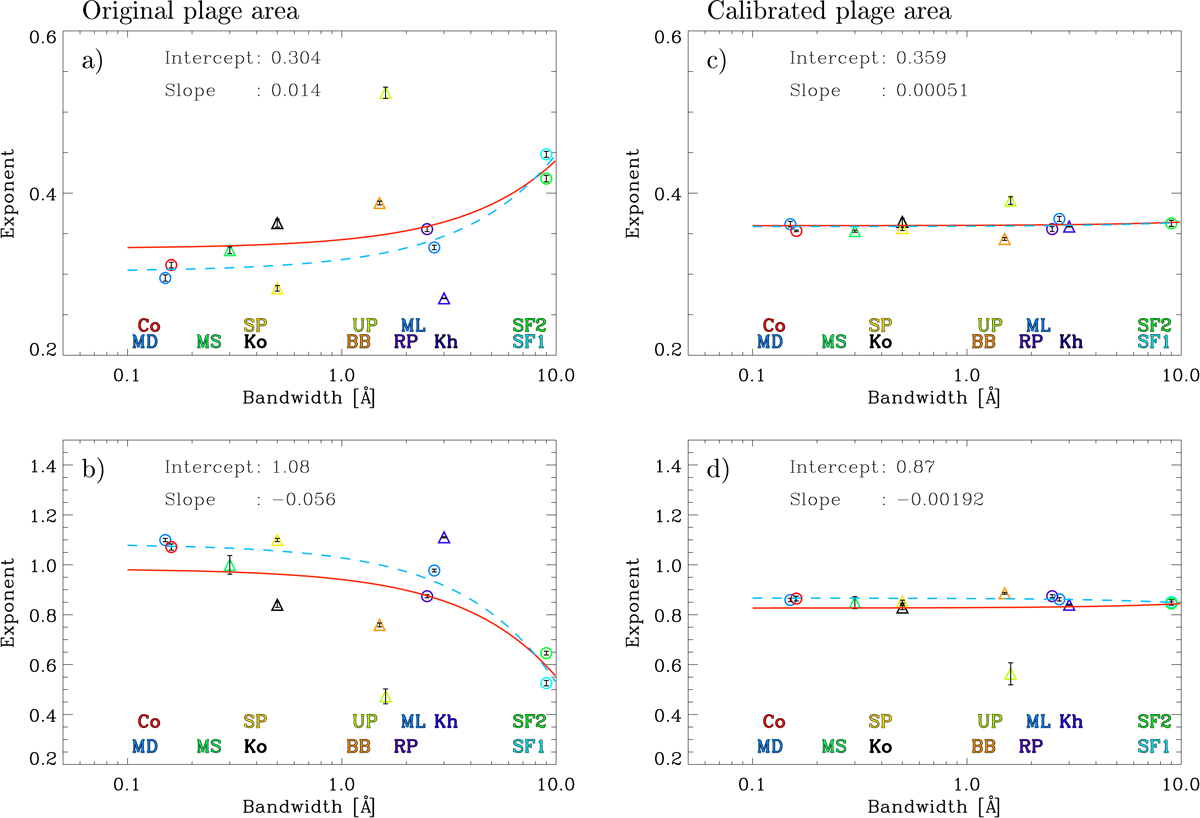
Fig. B.1.
Download original image
Dependence on bandwidth of the exponent of a power-law function and the slope of a linear fit between the plage areas and MEA20 sunspot area (a, c) and the CEA17 GSN (b, d), respectively. Shown are results over SC 23. The archives used to derive the plage areas are BB, Co, Kh, Ko, MD, ML, MS, RP, SF1, SF2, SP, and UP. The results shown in panels a) and b) are for the original plage area series from each archive, while those in panels c and d are for the plage areas after the scaling applied by Chatzistergos et al. (2020c) to cross-calibrate all series and merge them into the composite series. The symbols denote the fit result to the mean values of the PDF matrices (as shown in Fig. 1) along with the uncertainty of the fit parameter. Triangles are used for the archives for which there are inconsistencies rendering the bandwidth value uncertain, while circles are used for all other archives. The lines are linear fits for all points (solid red) and excluding the archives for which the nominal bandwidth appears inconsistent (dashed blue). The parameters of the latter fit are also written in each panel. Archive abbreviations at the bottom of each panel follow the order of the respective symbols in the plots.
Current usage metrics show cumulative count of Article Views (full-text article views including HTML views, PDF and ePub downloads, according to the available data) and Abstracts Views on Vision4Press platform.
Data correspond to usage on the plateform after 2015. The current usage metrics is available 48-96 hours after online publication and is updated daily on week days.
Initial download of the metrics may take a while.