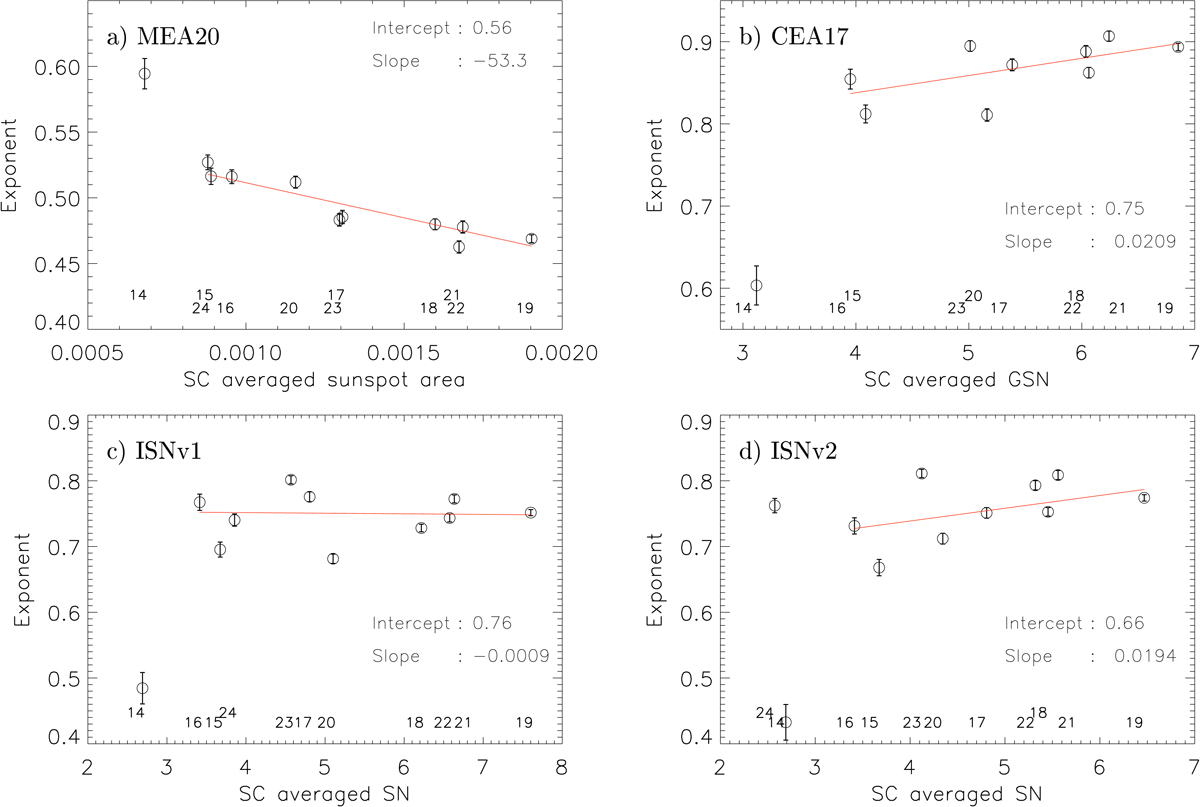
Fig. A.4.

Download original image
Exponents of power-law fits to the relation between the CEA20 plage area composite and MEA20 sunspot areas (panel a), and the CEA17 GSN (panel b), ISNv1 (panel c), and ISNv2 (panel d) series plotted as a function of SC average sunspot number. Solid red lines are linear fits to the individual SC values excluding SCs 13 and 14, which do not have enough statistics in the plage area composite. For the comparison to the sunspot number series SC 24 was also excluded since the CEA17 GSN series ends in 2010, while ISNv1 in 2014. The parameters of the linear fits are given in each panel. The numbers within the panels denote the conventional SC numbering.
Current usage metrics show cumulative count of Article Views (full-text article views including HTML views, PDF and ePub downloads, according to the available data) and Abstracts Views on Vision4Press platform.
Data correspond to usage on the plateform after 2015. The current usage metrics is available 48-96 hours after online publication and is updated daily on week days.
Initial download of the metrics may take a while.


