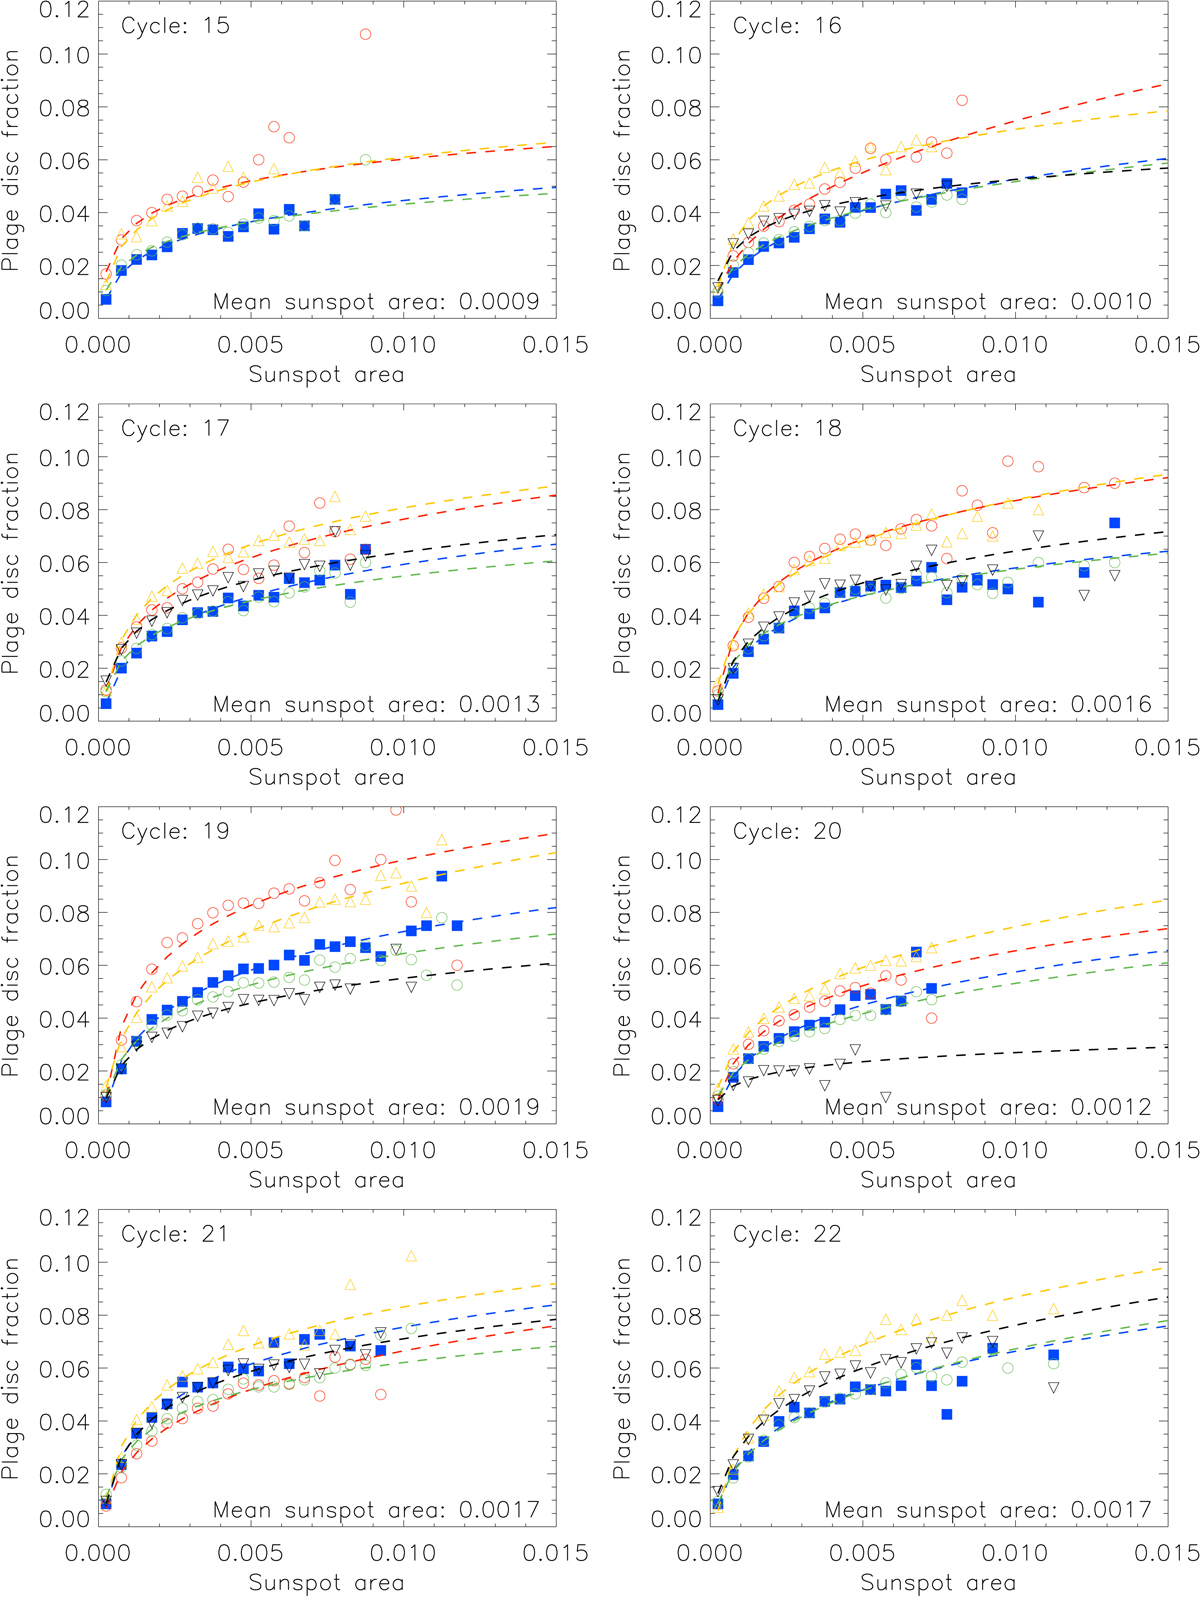
Fig. A.3.
Download original image
Similar to Fig. A.1, but here each panel shows the relationships for Co (black downward triangles), Ko (blue squares), MD (orange upward triangles), MW (red circles), and the CEA20 composite (green circles) series for individual SCs 15 to 22, as specified in each panel. Also listed in each panel is the cycle-averaged sunspot fractional area.
Current usage metrics show cumulative count of Article Views (full-text article views including HTML views, PDF and ePub downloads, according to the available data) and Abstracts Views on Vision4Press platform.
Data correspond to usage on the plateform after 2015. The current usage metrics is available 48-96 hours after online publication and is updated daily on week days.
Initial download of the metrics may take a while.