Fig. 1.
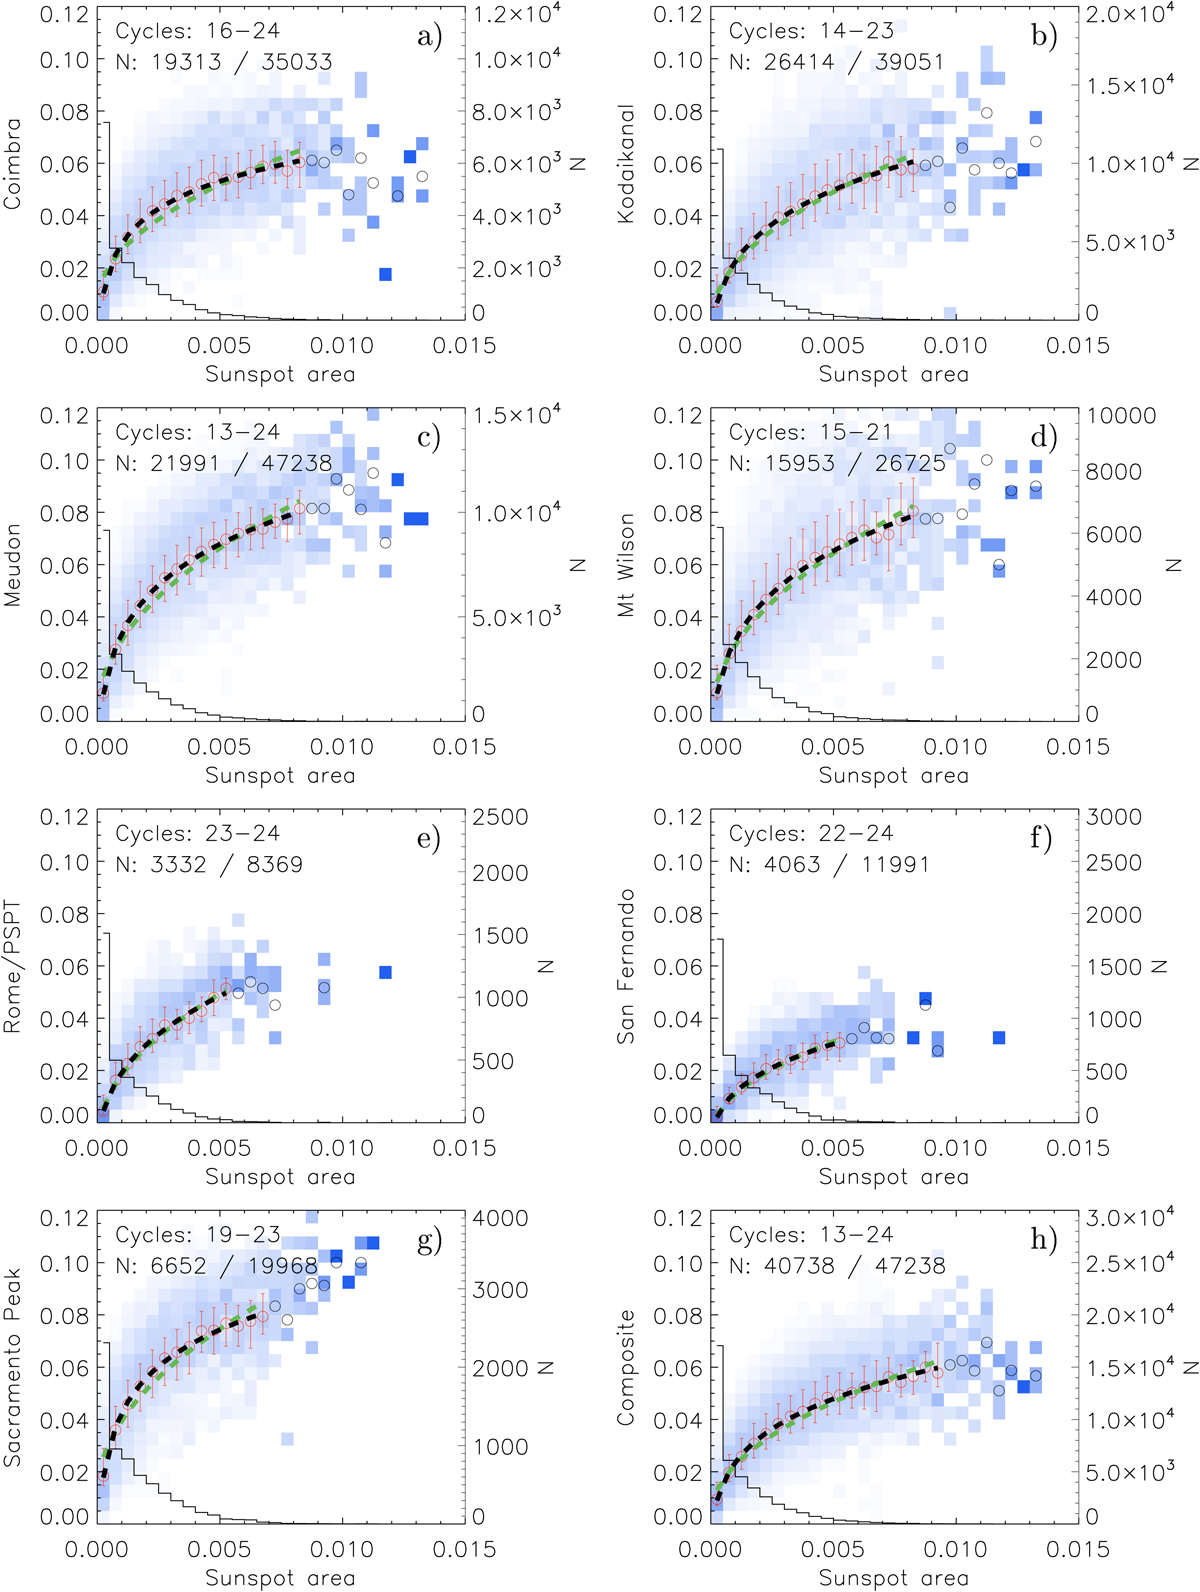
Download original image
Probability distribution functions (PDFs) for plage fractional areas as a function of the sunspot fractional areas from MEA20. Both plage and spot areas were taken on the same days. The PDFs are shown in bins of 0.005 and 0.0005 fractional areas for plage and sunspots, respectively. Each panel shows the PDF matrix for a given Ca II K archive; Co (a)), Ko (b)), MD (c)), MW (d)), RP (e)), SF2 (f)), SP (g)), and the CEA20 plage area composite (h)). The PDFs are colour-coded between white for 0 and bright blue for 1. Circles denote the average plage area value within each column. For columns with less than 20 days of data these circles are shown in black, otherwise in red. Also shown is the asymmetric 1σ interval for each column. Two different fits to the average values are overplotted: a power-law fit (black) and a square-root function (green). The number of days included in each column is also shown as a solid black histogram (see right-hand axis). The period of overlap between the two archives shown in a given panel (expressed in solar cycles), as well as the total number of overlapping days used to construct each matrix (N) and the total number of days within this time interval are listed in the top part of each panel.
Current usage metrics show cumulative count of Article Views (full-text article views including HTML views, PDF and ePub downloads, according to the available data) and Abstracts Views on Vision4Press platform.
Data correspond to usage on the plateform after 2015. The current usage metrics is available 48-96 hours after online publication and is updated daily on week days.
Initial download of the metrics may take a while.