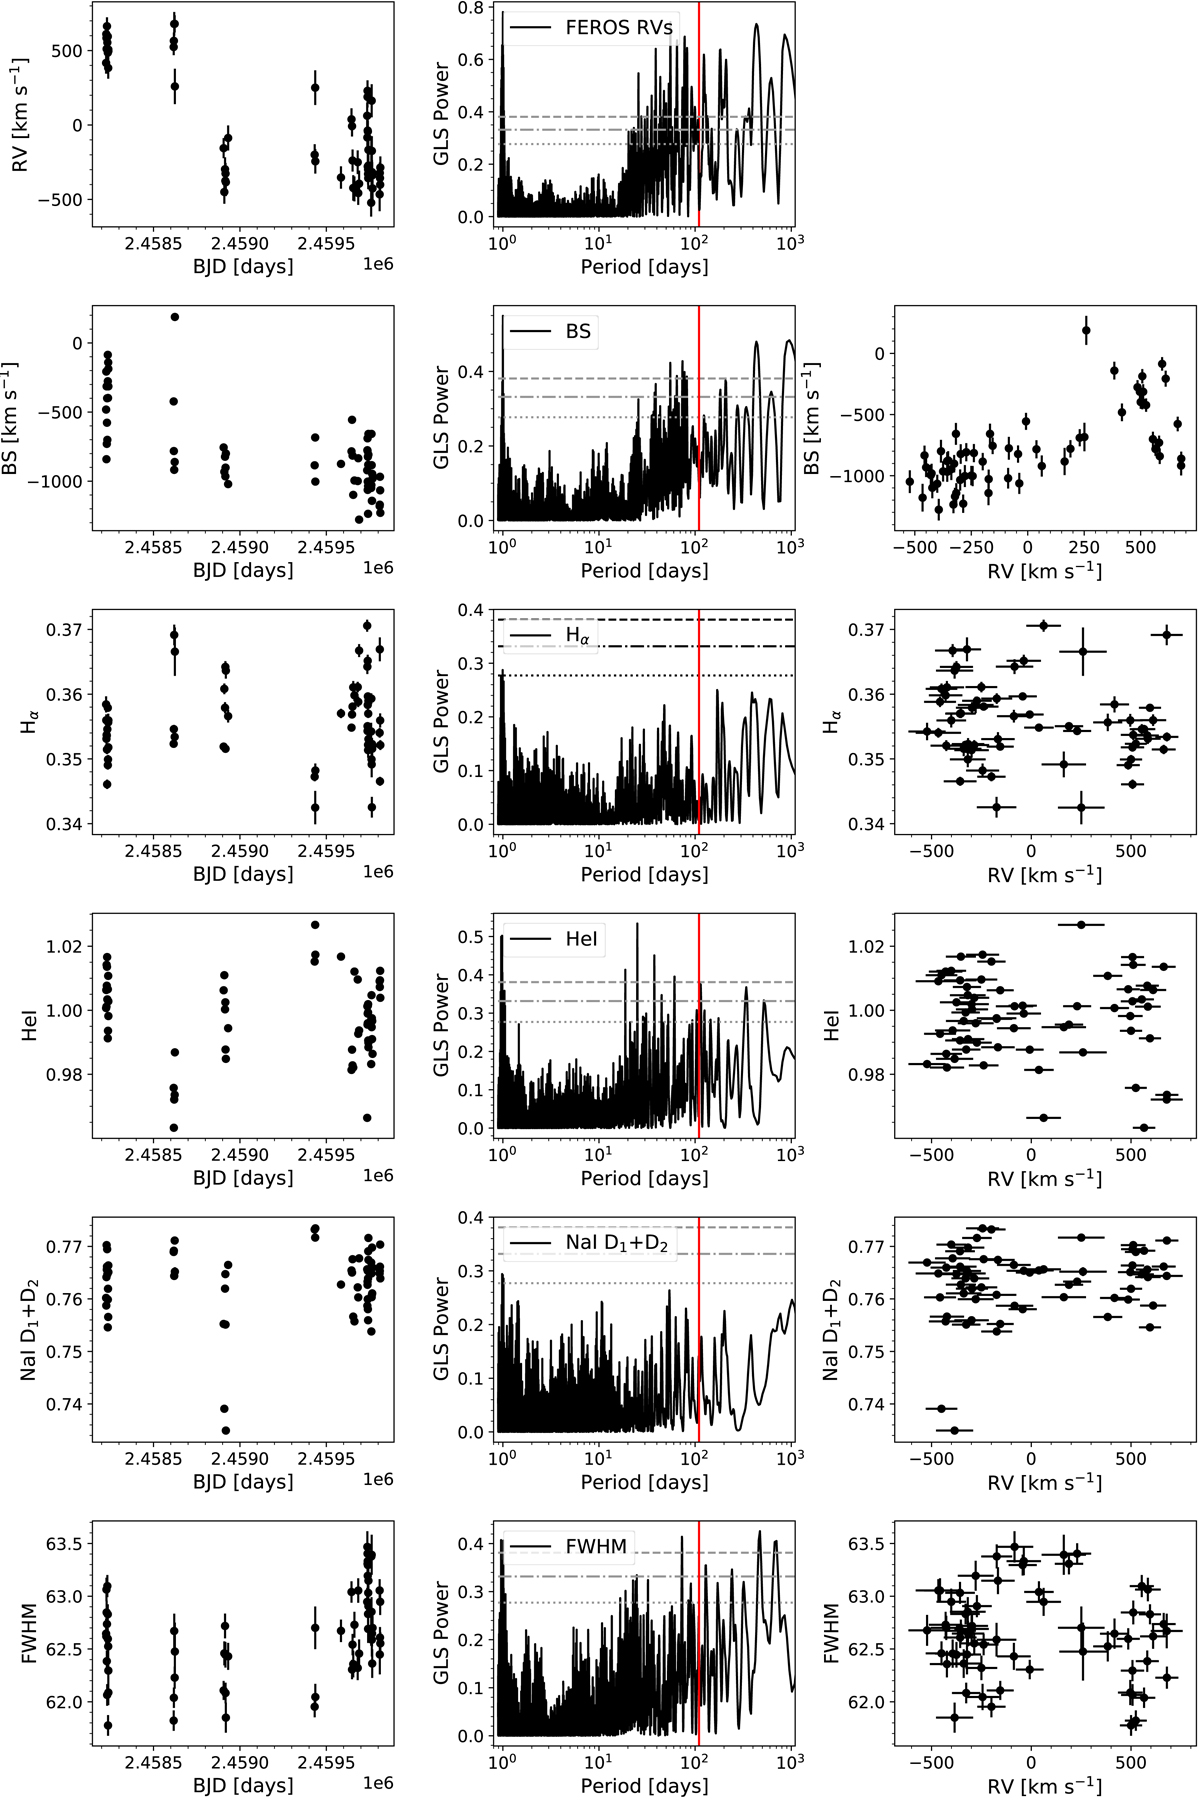
Fig. A.3.
Download original image
Time series and GLS of the RVs and activity indicators derived from the FEROS spectra (left and middle panels, respectively). The right panels show the correlation with respect to the FEROS RVs for the derived key activity indicators. The type of activity indicator is given in each of the panels of the middle column. The vertical red line shows the suspected planetary period (P = 109.8 d), from the model with linear trend of the combined RVs (FEROS+HARPS) and photometric (TESS) data.
Current usage metrics show cumulative count of Article Views (full-text article views including HTML views, PDF and ePub downloads, according to the available data) and Abstracts Views on Vision4Press platform.
Data correspond to usage on the plateform after 2015. The current usage metrics is available 48-96 hours after online publication and is updated daily on week days.
Initial download of the metrics may take a while.