Open Access
Fig. 4.
Download original image
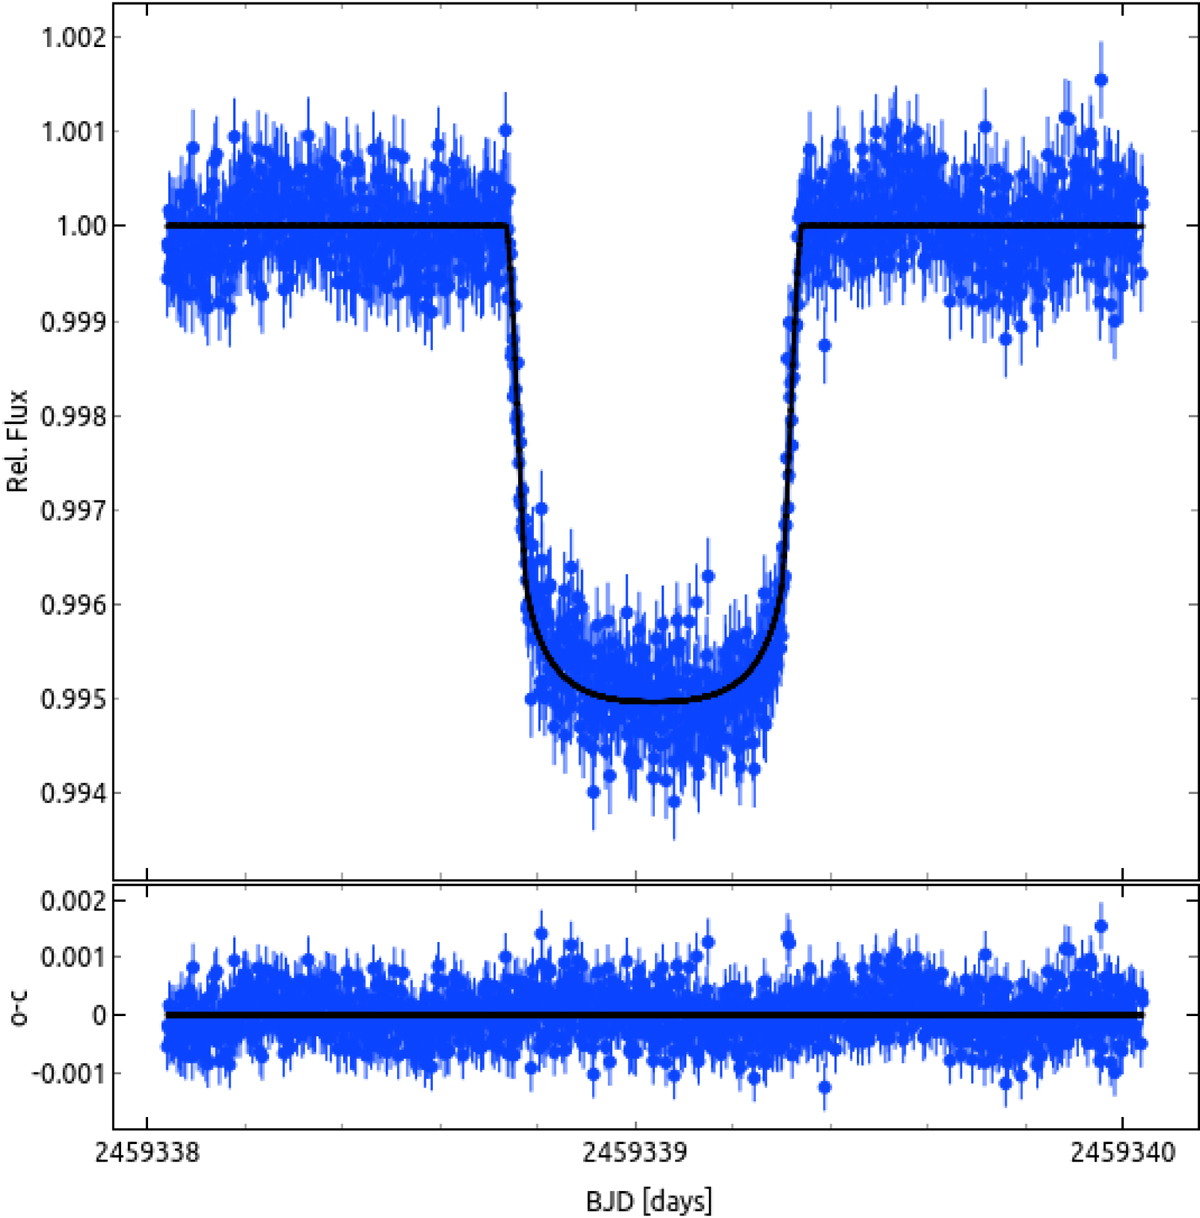
Baseline-corrected sector 38 TESS data (relative flux) for HD 114082 around the transit event with the best-fit model of the transit overlaid (black line). The bottom panel shows the residuals of the fit.
Current usage metrics show cumulative count of Article Views (full-text article views including HTML views, PDF and ePub downloads, according to the available data) and Abstracts Views on Vision4Press platform.
Data correspond to usage on the plateform after 2015. The current usage metrics is available 48-96 hours after online publication and is updated daily on week days.
Initial download of the metrics may take a while.