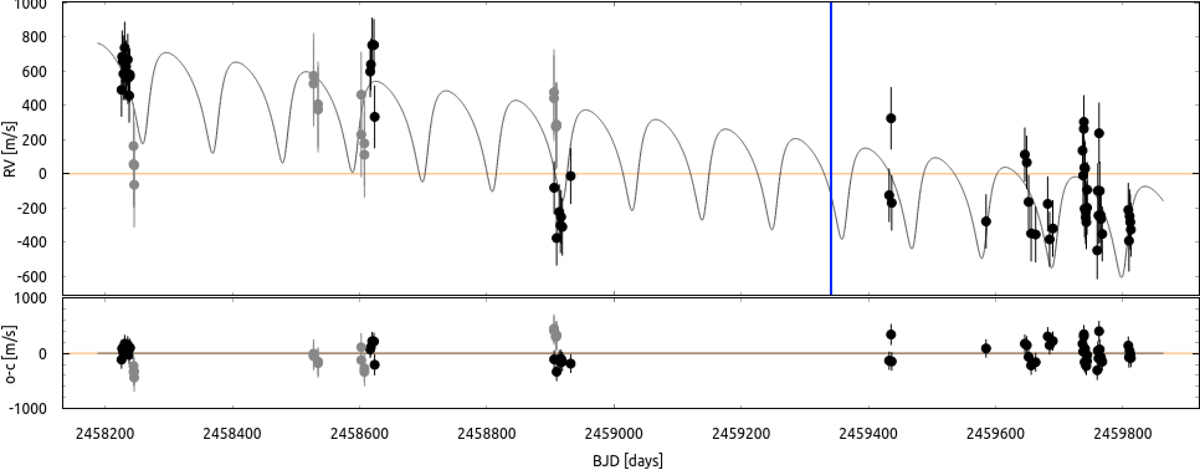
Fig. 2.
Download original image
RV time series data for HD 114082. FEROS data from RVSPY are shown as black circles. The RVs computed from the publicly available HARPS spectra are shown as gray circles. Error bars account for the suspected activity jitter (see text for details). The solid gray line shows the best-fit model (see parameters in Table 2), and the vertical blue line indicates the time of the observed transit. The lower panel shows the residuals of the fit.
Current usage metrics show cumulative count of Article Views (full-text article views including HTML views, PDF and ePub downloads, according to the available data) and Abstracts Views on Vision4Press platform.
Data correspond to usage on the plateform after 2015. The current usage metrics is available 48-96 hours after online publication and is updated daily on week days.
Initial download of the metrics may take a while.