Fig. 9
Download original image
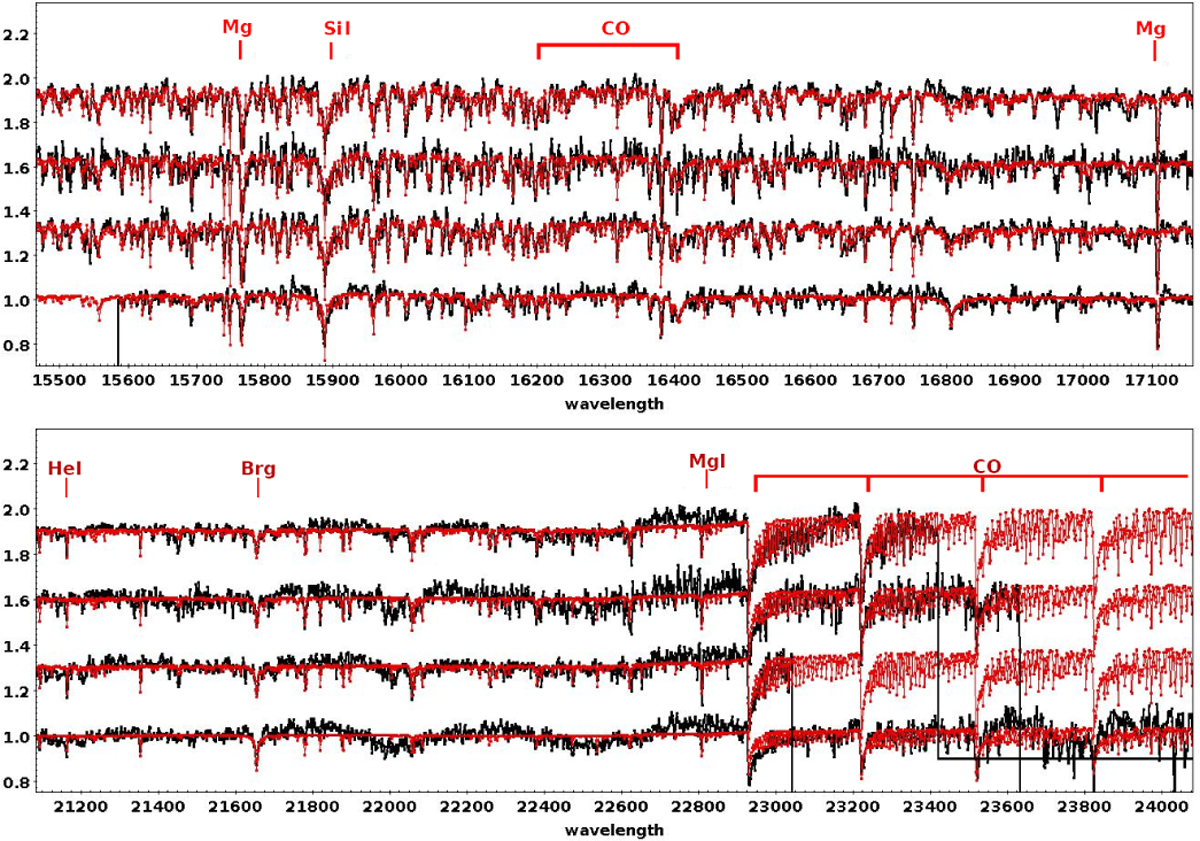
Example of spectra in the H band (upper panel) and K band (lower panel) of red giants candidates taken with EMIR in MOS mode. The slit width is set as 0.8″ for all objects. The red lines above the spectra are the atmospheric models fitted with Ferre (Allende Prieto et al. 2006). The spectra, normalised in flux, are shifted in vertical to fit within the figure. Units on the X-axis are the wavelengths in angstroms.
Current usage metrics show cumulative count of Article Views (full-text article views including HTML views, PDF and ePub downloads, according to the available data) and Abstracts Views on Vision4Press platform.
Data correspond to usage on the plateform after 2015. The current usage metrics is available 48-96 hours after online publication and is updated daily on week days.
Initial download of the metrics may take a while.