Fig. 8
Download original image
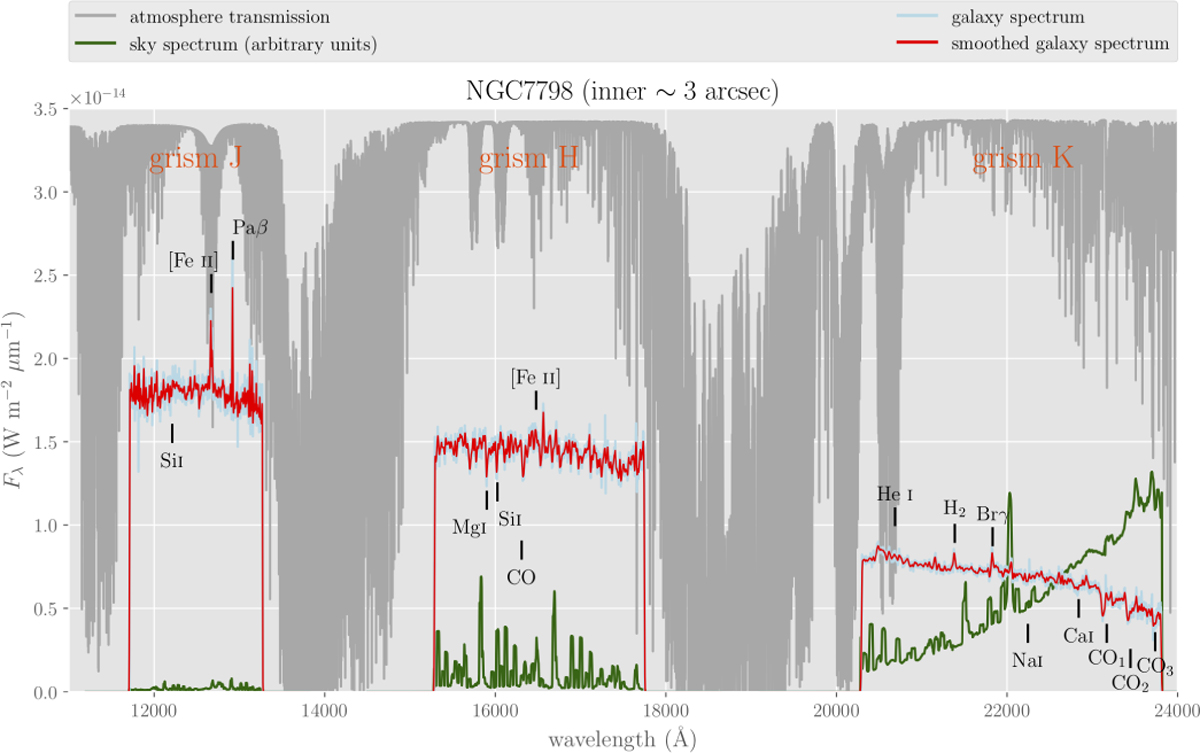
Central spectrum (inner ~3 arcsec) of the galaxy NGC 7798, observed during the commissioning time of EMIR (July 2016). This plot combines the flux-calibrated spectra in J, H, and K (blue curve; smoothed version in red), together with the sky spectrum in arbitrary units (green) and the atmospheric transmission (light grey). Some conspicuous emission lines in the galaxy spectra are labelled.
Current usage metrics show cumulative count of Article Views (full-text article views including HTML views, PDF and ePub downloads, according to the available data) and Abstracts Views on Vision4Press platform.
Data correspond to usage on the plateform after 2015. The current usage metrics is available 48-96 hours after online publication and is updated daily on week days.
Initial download of the metrics may take a while.