Fig. 6
Download original image
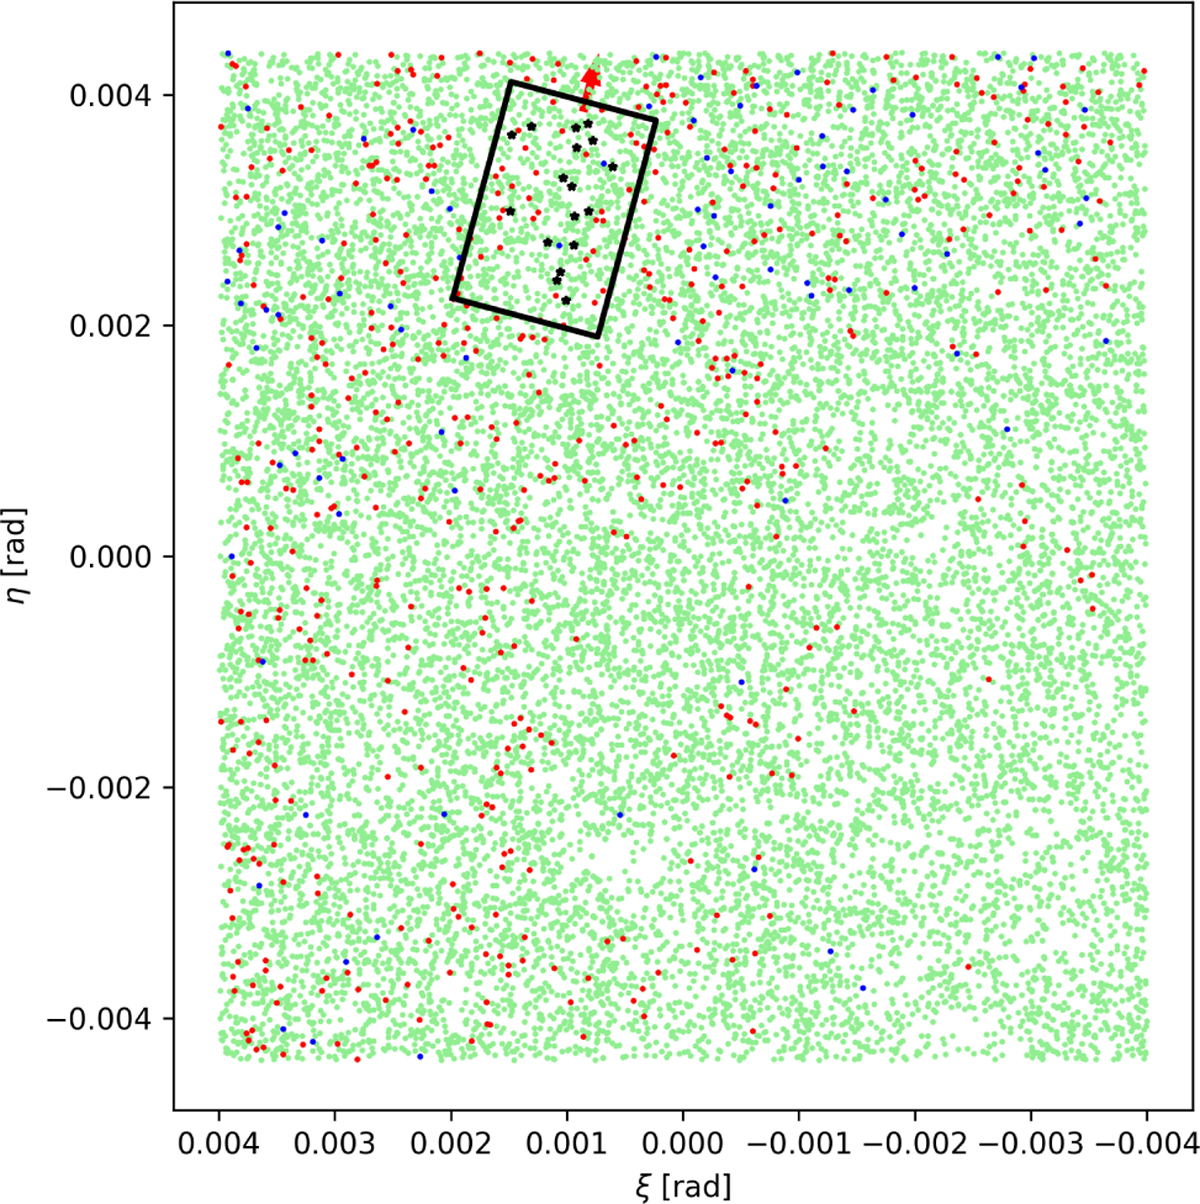
Sketch of an optimum mask positioned on the field. The red arrow shows the orientation of the CSU and defines the position angle of the instrument. The green dots are field objects, the red dots are objects of interest, and the blue dots are bright objects that can be used as fiducial objects for pointing. Inside the mask the selected objects, either red or blue, are represented as black stars. The axes are in standard coordinates.
Current usage metrics show cumulative count of Article Views (full-text article views including HTML views, PDF and ePub downloads, according to the available data) and Abstracts Views on Vision4Press platform.
Data correspond to usage on the plateform after 2015. The current usage metrics is available 48-96 hours after online publication and is updated daily on week days.
Initial download of the metrics may take a while.