Fig. 4
Download original image
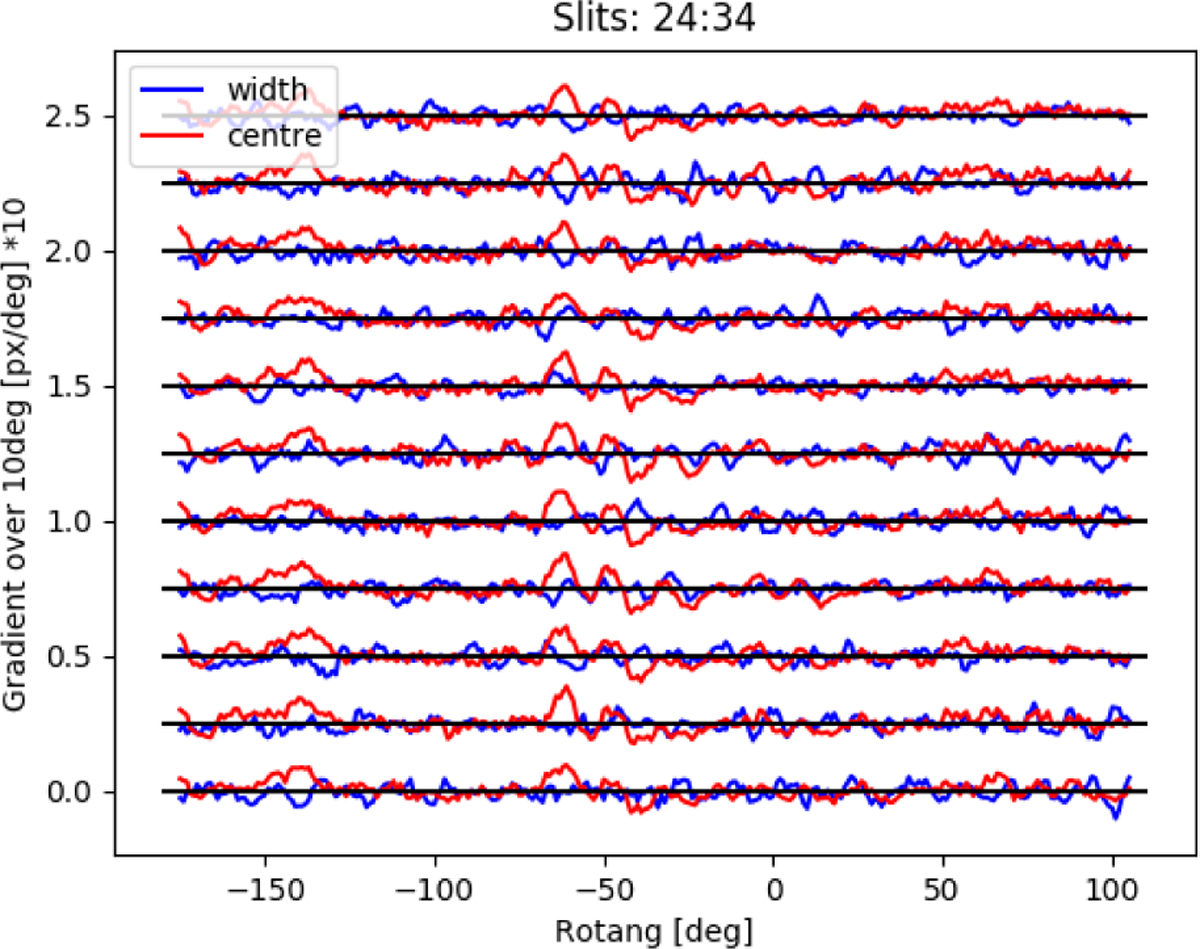
Displacement of slit centres (red lines) and slit widths (blue lines) with the turn of EMIR in the Nasmyth rotator for the slit numbers given in the plot title. These are displayed in terms of gradients of the magnitudes per 10° of rotation angle. The values are multiplied by a factor of 10 to visualise them. See text for explanation.
Current usage metrics show cumulative count of Article Views (full-text article views including HTML views, PDF and ePub downloads, according to the available data) and Abstracts Views on Vision4Press platform.
Data correspond to usage on the plateform after 2015. The current usage metrics is available 48-96 hours after online publication and is updated daily on week days.
Initial download of the metrics may take a while.