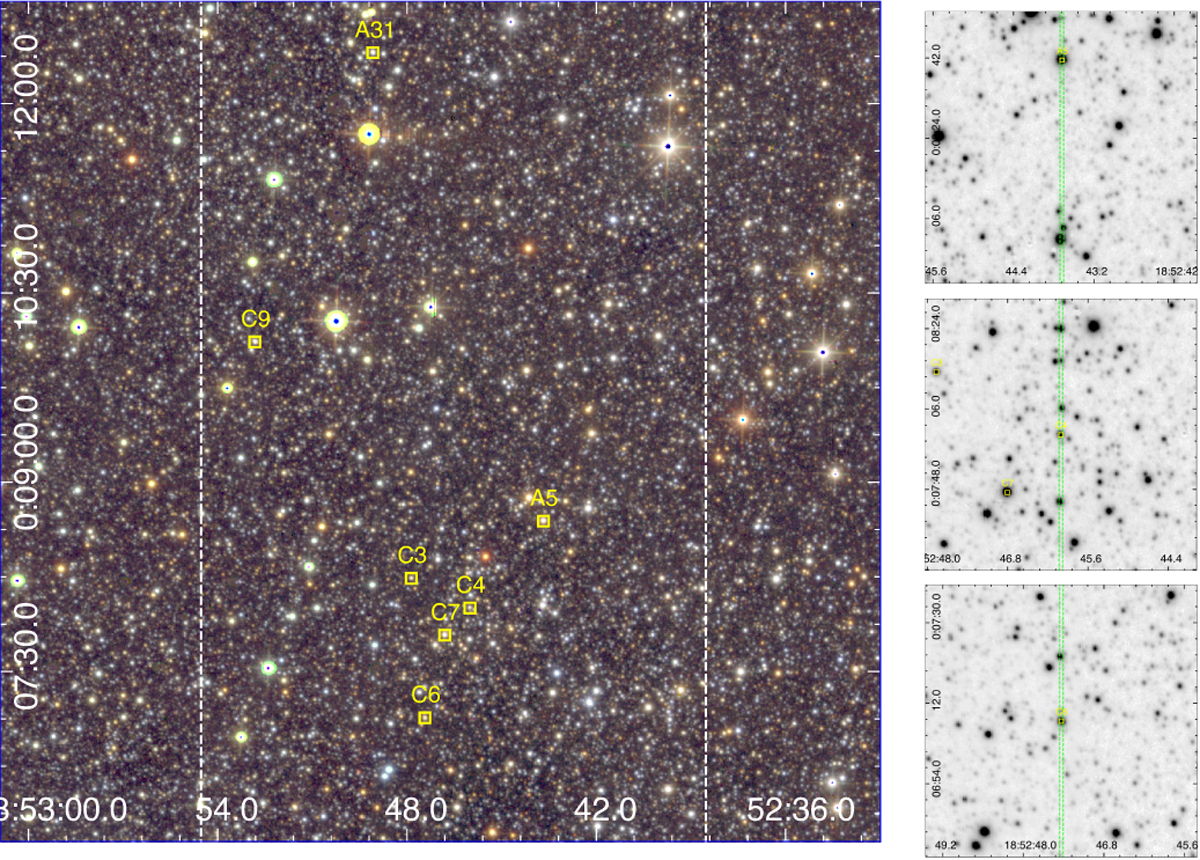
Fig. 10
Download original image
Preparing the observation of the MASGOMAS-10 cluster candidate with EMIR. Left: false colour UKIDSS-GPS image of MASGOMAS-10 (J: blue, H: green, KS: red). The white dashed central rectangle shows EMIR’s field of view in spectroscopic mode. The stars observed with EMIR during the spectroscopic campaigns are shown as yellow squares (labelled using the internal ID numbers). North is up, east to the left. Right: slit position and orientation is critical to exclude contamination during the ABBA observing patterns. These three images show a 0.8 arcsec slit (green dashed rectangle) on three studied stars, and some possible contaminants on the slit. A careful determination of slit parameters reduces this contamination effect and the ABBA overlapping.
Current usage metrics show cumulative count of Article Views (full-text article views including HTML views, PDF and ePub downloads, according to the available data) and Abstracts Views on Vision4Press platform.
Data correspond to usage on the plateform after 2015. The current usage metrics is available 48-96 hours after online publication and is updated daily on week days.
Initial download of the metrics may take a while.