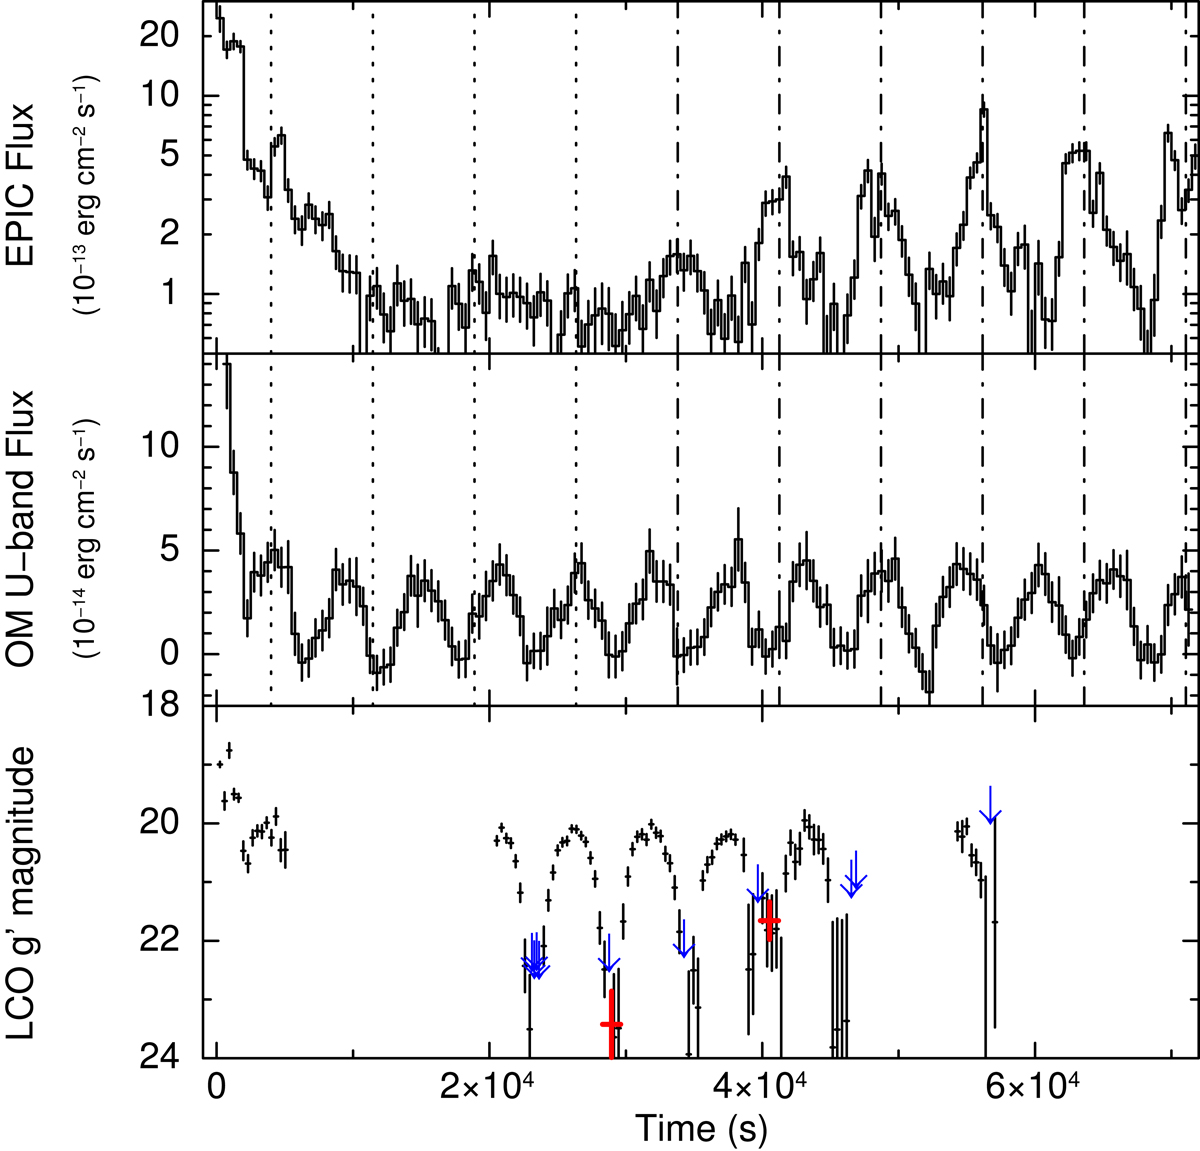
Fig. 1.
Download original image
Multi-wavelength light curves of PSR J1311−3430. Top panel: 0.15–10 keV energy range, XMM-Newton/EPIC data (background-subtracted, 500 s binning). A count rate to flux conversion was performed using results of time-averaged spectroscopy. The approximate time of the centres of the six ‘pulses’ is marked by vertical dashed-dotted lines (adopting 7450 s as the recurrence time – see Sect. 2.1). We also extended to earlier times the expected time of arrivals (dotted lines) to show the possible alignment of a further peak at T = 4000 s with the pulses. The first pulse peak occurs at orbital phase 0.08 ± 0.03 (as computed from the U-band light curve, phase 0.75 marking the companion star superior conjunction). Middle panel: U band, XMM-Newton/OM data (background-subtracted, 500 s binning). Bottom panel: g′ band, Las Cumbres Observatory – 1 m telescope data. Black points represent 103 observations lasting 300 s; red points correspond to the sum of four observations (totalling 1200 s integration) collected around the times of two different g′ light-curve minima, with the first being associated with quiescent X-ray emission (g′ = 23.4 ± 0.5) and the second being associated with an X-ray pulse (g′ = 21.6 ± 0.3); and upper limits are shown as blue arrows. For all of the panels, time was measured in seconds since 2018 February 09 22:18:50.8. Error bars show uncertainties at the 1σ confidence level.
Current usage metrics show cumulative count of Article Views (full-text article views including HTML views, PDF and ePub downloads, according to the available data) and Abstracts Views on Vision4Press platform.
Data correspond to usage on the plateform after 2015. The current usage metrics is available 48-96 hours after online publication and is updated daily on week days.
Initial download of the metrics may take a while.