Open Access
Fig. 2
Download original image
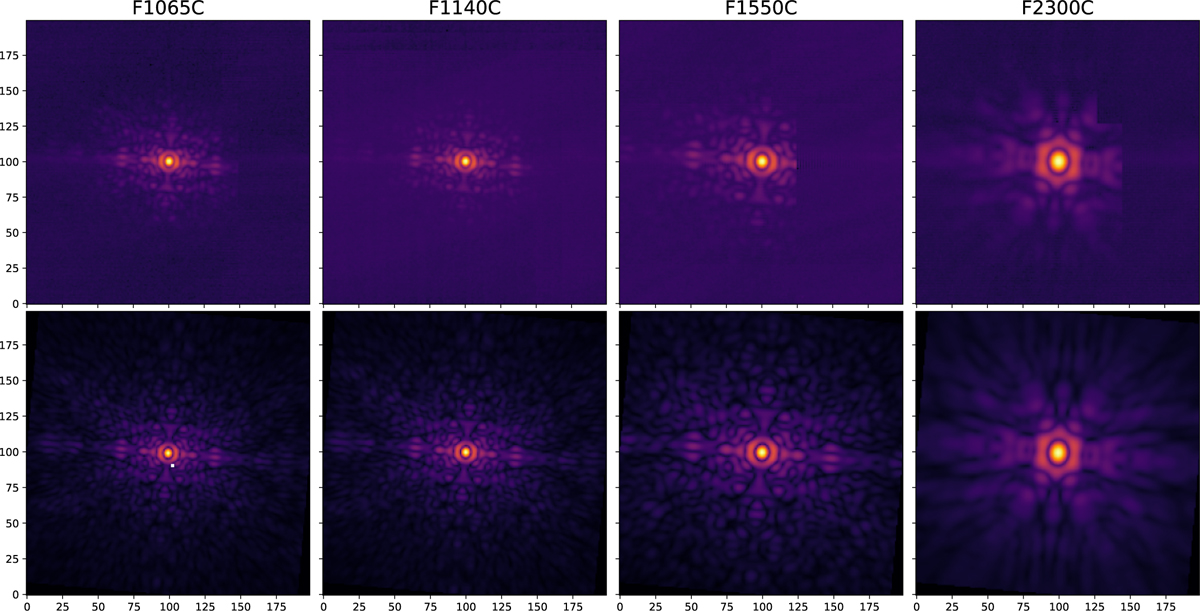
Observed (top) versus simulated (bottom) PSFs (off-axis) in the four coronagraphic filters. The pixel scale is 110 mas. Some PSFs are cropped by the edges of the coronagraph’s mechanical support. Simulated data use the nominal scenario (see Table 3). The intensity scale is not linear.
Current usage metrics show cumulative count of Article Views (full-text article views including HTML views, PDF and ePub downloads, according to the available data) and Abstracts Views on Vision4Press platform.
Data correspond to usage on the plateform after 2015. The current usage metrics is available 48-96 hours after online publication and is updated daily on week days.
Initial download of the metrics may take a while.