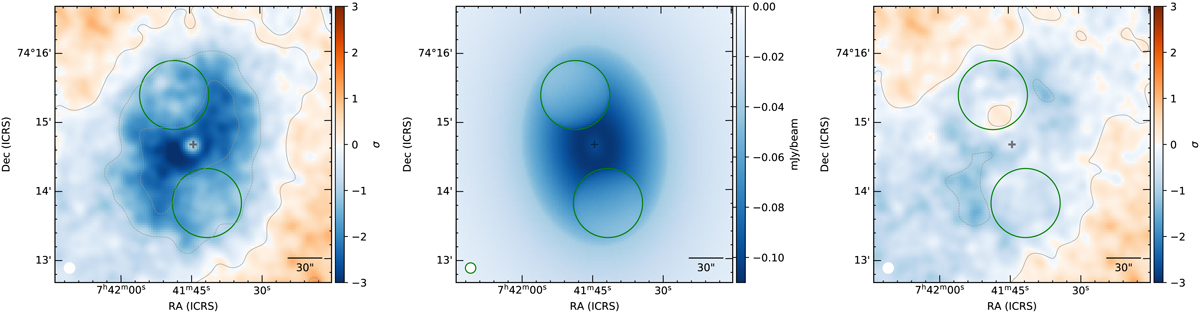
Fig. 4.
Download original image
Signal-to-noise ratio (S/N) map for MS0735 for the data (left) and residual of the data minus the TOD with shock r3 = r1 variation (right), which is the ninth variation listed in Table 3. The contours are at steps of S/N = 1. The cross indicates the cluster center, and the circles show the X-ray-identified bubble locations. The white circle in the bottom left shows the MUSTANG-2 beam. The noise at the center of the maps is ∼10 μK.
Current usage metrics show cumulative count of Article Views (full-text article views including HTML views, PDF and ePub downloads, according to the available data) and Abstracts Views on Vision4Press platform.
Data correspond to usage on the plateform after 2015. The current usage metrics is available 48-96 hours after online publication and is updated daily on week days.
Initial download of the metrics may take a while.