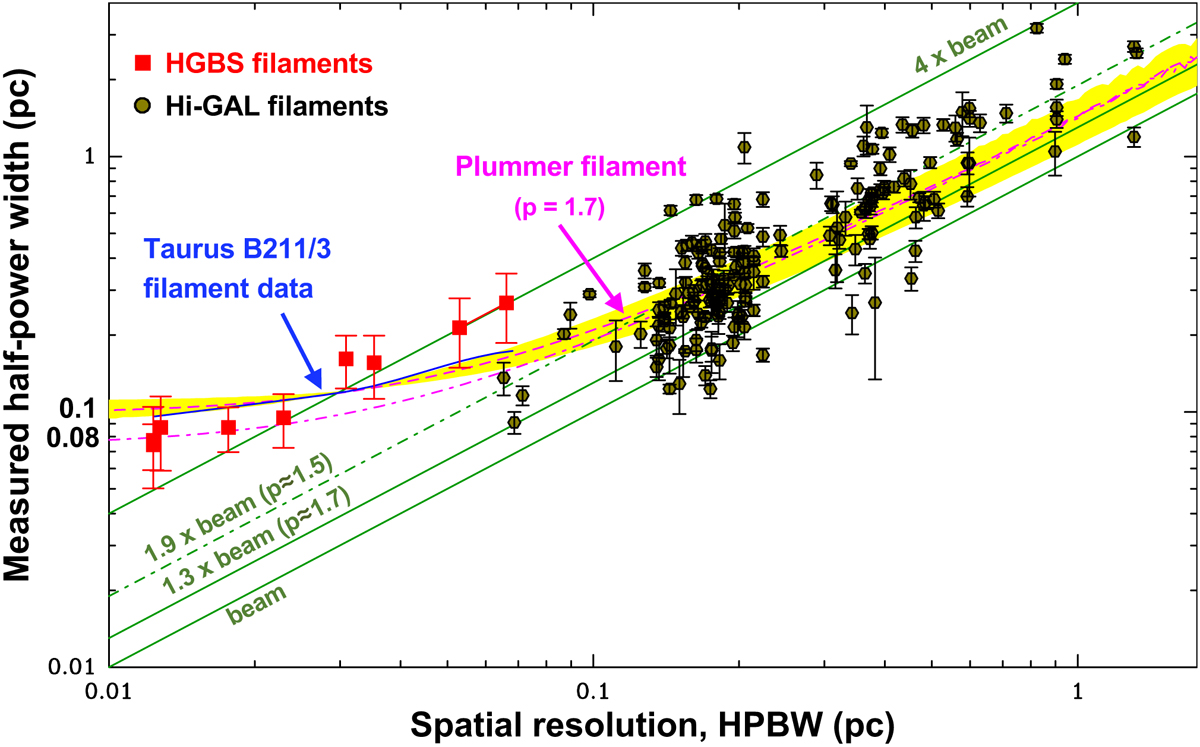
Fig. D.1.
Download original image
Mean apparent HP width (without any deconvolution) versus spatial resolution for both HGBS filaments (red squares from Arzoumanian et al. 2019) and Hi-GAL filaments (black circles from Schisano et al. 2014). The red error bars correspond to ± the standard deviations of measured widths in each HGBS cloud. The black error bars correspond to ± the standard deviation of individual width estimates along each Hi-GAL filament in the Schisano et al. sample. The lines, curves, and yellow shading are the same as in Fig. 4.
Current usage metrics show cumulative count of Article Views (full-text article views including HTML views, PDF and ePub downloads, according to the available data) and Abstracts Views on Vision4Press platform.
Data correspond to usage on the plateform after 2015. The current usage metrics is available 48-96 hours after online publication and is updated daily on week days.
Initial download of the metrics may take a while.