Fig. 5

Download original image
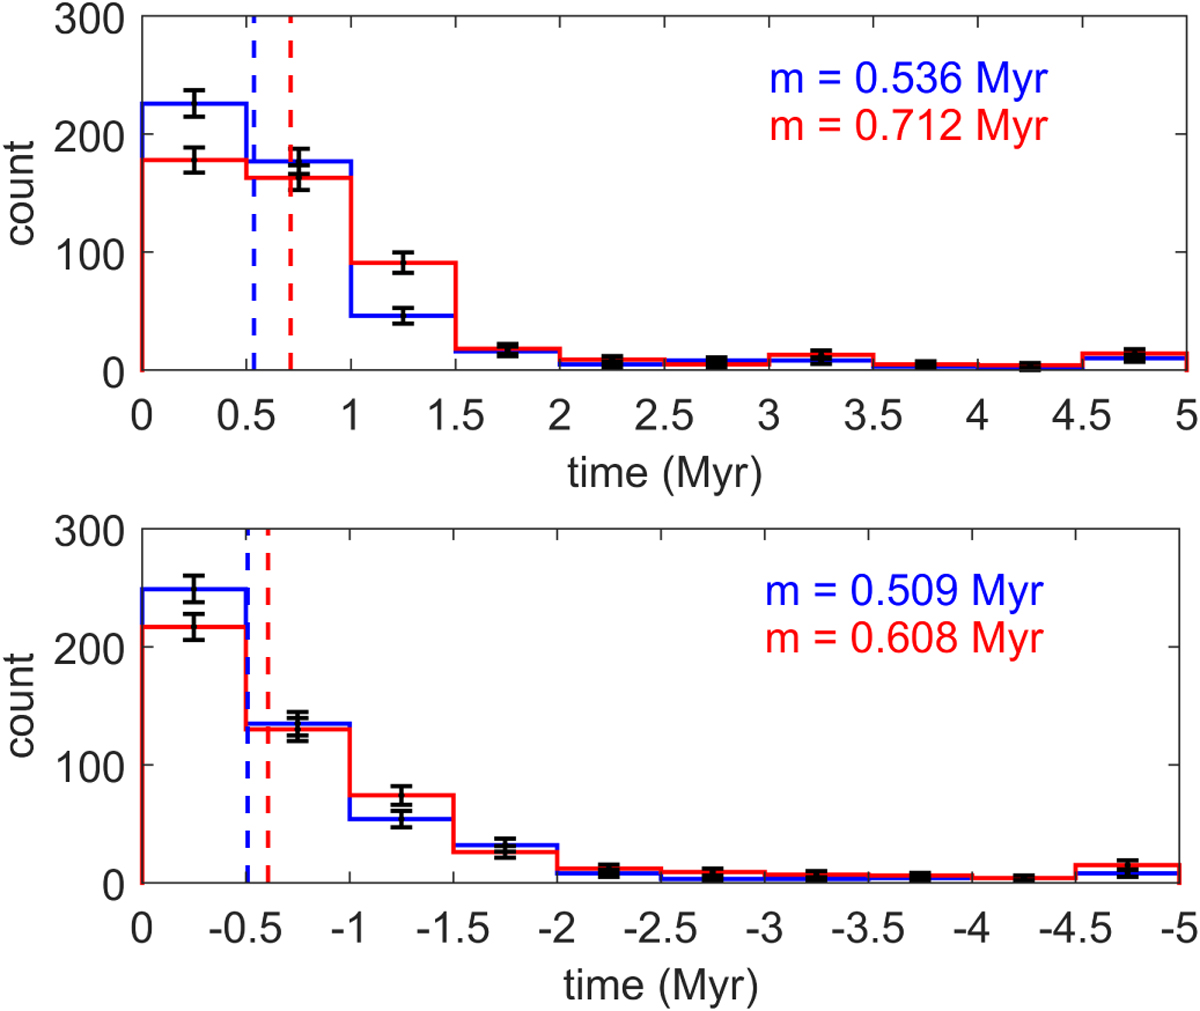
Distributions of the time spent in the Earth co-orbital region T1:1 for clonal orbits over the time interval (−5, 5) Myr. The top panel corresponds to the distribution of the time spent over the time interval (0, 5) Myr. The bottom panel corresponds to the distribution of the time spent over the time interval (−5, 0) Myr. The blue colour corresponds to the case of including the Yarkovsky effect. The red colour corresponds to the case of purely gravitational perturbation. Vertical dashed lines denote the medians of the distributions, and the corresponding numerical values are written in each panel. Error bars in the histograms are relative to each entire bin, which are computed using Bernoulli statistics. Each bin width is set to 0.5 Myr.
Current usage metrics show cumulative count of Article Views (full-text article views including HTML views, PDF and ePub downloads, according to the available data) and Abstracts Views on Vision4Press platform.
Data correspond to usage on the plateform after 2015. The current usage metrics is available 48-96 hours after online publication and is updated daily on week days.
Initial download of the metrics may take a while.


