Fig. 6
Download original image
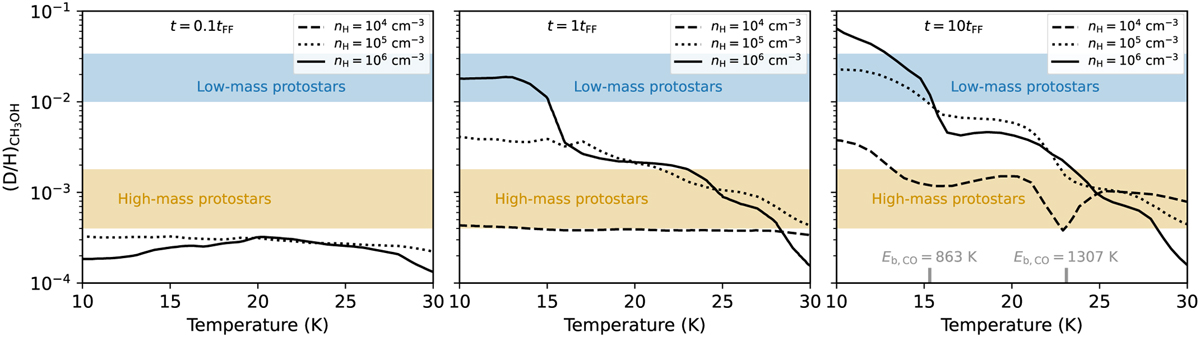
![]() ratio in the ices as function of the gas and dust temperature for nH = 104 (dashed), 105 (dotted), and 106 cm3 (solid) as modeled by Bøgelund et al. (2018) and Taquet et al. (2019) using the GRAINOBLE model (Taquet et al. 2012, 2013, 2014). The model results are shown for 0.1 (left), 1 (middle), and 10 (right) times free-fall timescales tFF. The observed average
ratio in the ices as function of the gas and dust temperature for nH = 104 (dashed), 105 (dotted), and 106 cm3 (solid) as modeled by Bøgelund et al. (2018) and Taquet et al. (2019) using the GRAINOBLE model (Taquet et al. 2012, 2013, 2014). The model results are shown for 0.1 (left), 1 (middle), and 10 (right) times free-fall timescales tFF. The observed average ![]() ratios are indicated in blue and orange for the low-mass and high-mass protostars, respectively. In the right panel, the range of possible desorption temperature of CO ice is indicated with the gray bars for binding energies between 863 K and 1307 K for CO ice deposited on non-porous amorphous solid water (Noble et al. 2012).
ratios are indicated in blue and orange for the low-mass and high-mass protostars, respectively. In the right panel, the range of possible desorption temperature of CO ice is indicated with the gray bars for binding energies between 863 K and 1307 K for CO ice deposited on non-porous amorphous solid water (Noble et al. 2012).
Current usage metrics show cumulative count of Article Views (full-text article views including HTML views, PDF and ePub downloads, according to the available data) and Abstracts Views on Vision4Press platform.
Data correspond to usage on the plateform after 2015. The current usage metrics is available 48-96 hours after online publication and is updated daily on week days.
Initial download of the metrics may take a while.