Fig. 4
Download original image
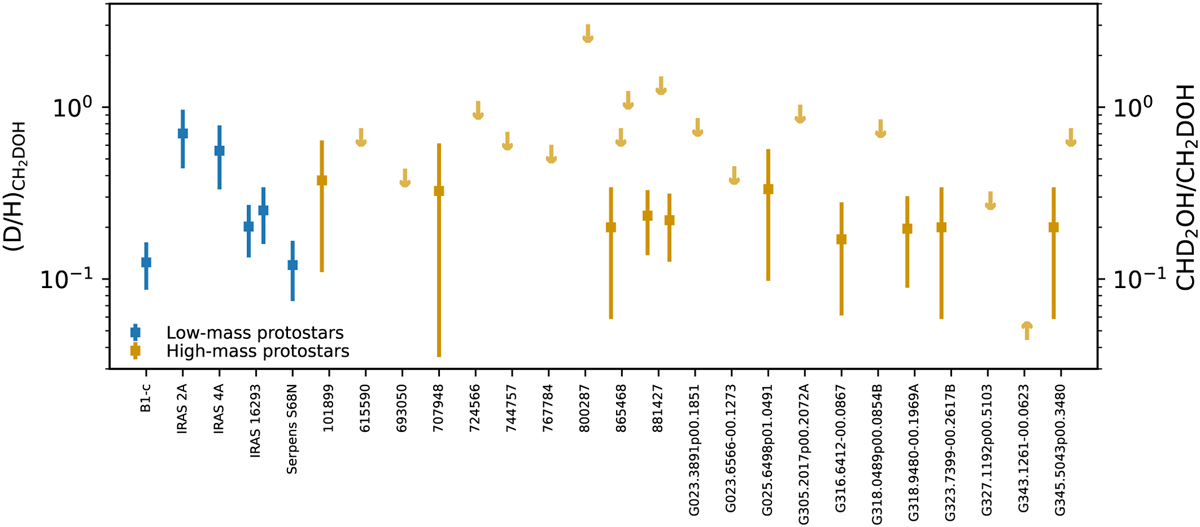
![]() ratio derived from the
ratio derived from the ![]() for low-mass and high-mass protostellar systems including data from both this study and the literature (see Appendix C for references). Upper and lower limits are presented as arrows. Only D/H ratios derived from interferometric observations are included to minimize effects of beam dilution and to exclude any contribution from larger scales. The
for low-mass and high-mass protostellar systems including data from both this study and the literature (see Appendix C for references). Upper and lower limits are presented as arrows. Only D/H ratios derived from interferometric observations are included to minimize effects of beam dilution and to exclude any contribution from larger scales. The ![]() of IRAS 2A and IRAS 4A were derived using older spectroscopic data (Taquet et al. 2019).
of IRAS 2A and IRAS 4A were derived using older spectroscopic data (Taquet et al. 2019).
Current usage metrics show cumulative count of Article Views (full-text article views including HTML views, PDF and ePub downloads, according to the available data) and Abstracts Views on Vision4Press platform.
Data correspond to usage on the plateform after 2015. The current usage metrics is available 48-96 hours after online publication and is updated daily on week days.
Initial download of the metrics may take a while.