Fig. 1
Download original image
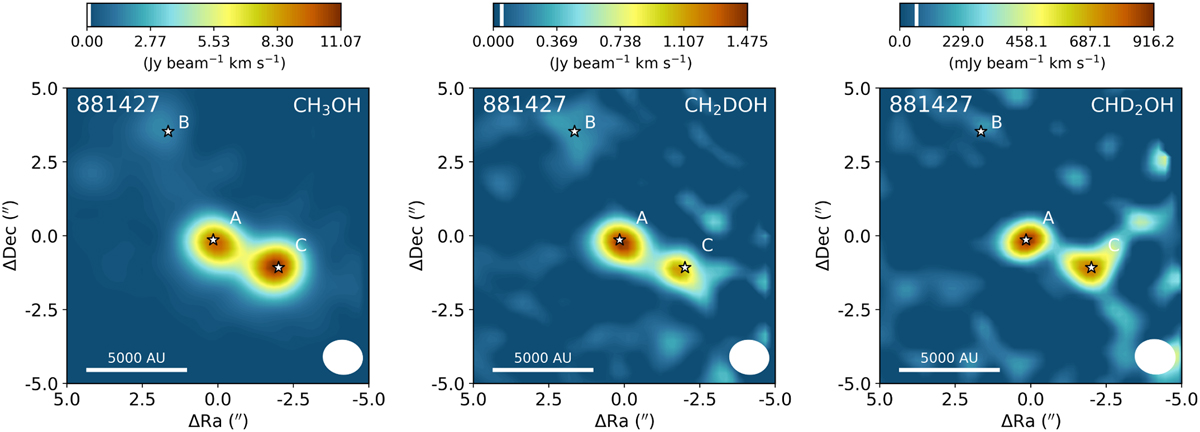
Integrated intensity maps of the CH3OH 80,8–71,6 (Eup = 97 K, left), CH2DOH 171,16 e0 – 170,17 e0 (Eup = 336 K, middle), and CHD2OH 70,1 e1 – 61,1 e1 (Eup = 74 K, right) lines for 881427. The color scale is shown on top of each image. The image is integrated over [−5, 5] km s−1 with respect to the Vlsr of source A. The white vertical line in the colorbar indicates the 3σ threshold. The source positions based on the continuum emission are indicated with the white stars. The white ellipse in the lower right of each image depicts the beam size and in the lower left a physical scale bar is displayed.
Current usage metrics show cumulative count of Article Views (full-text article views including HTML views, PDF and ePub downloads, according to the available data) and Abstracts Views on Vision4Press platform.
Data correspond to usage on the plateform after 2015. The current usage metrics is available 48-96 hours after online publication and is updated daily on week days.
Initial download of the metrics may take a while.