Fig. 2.
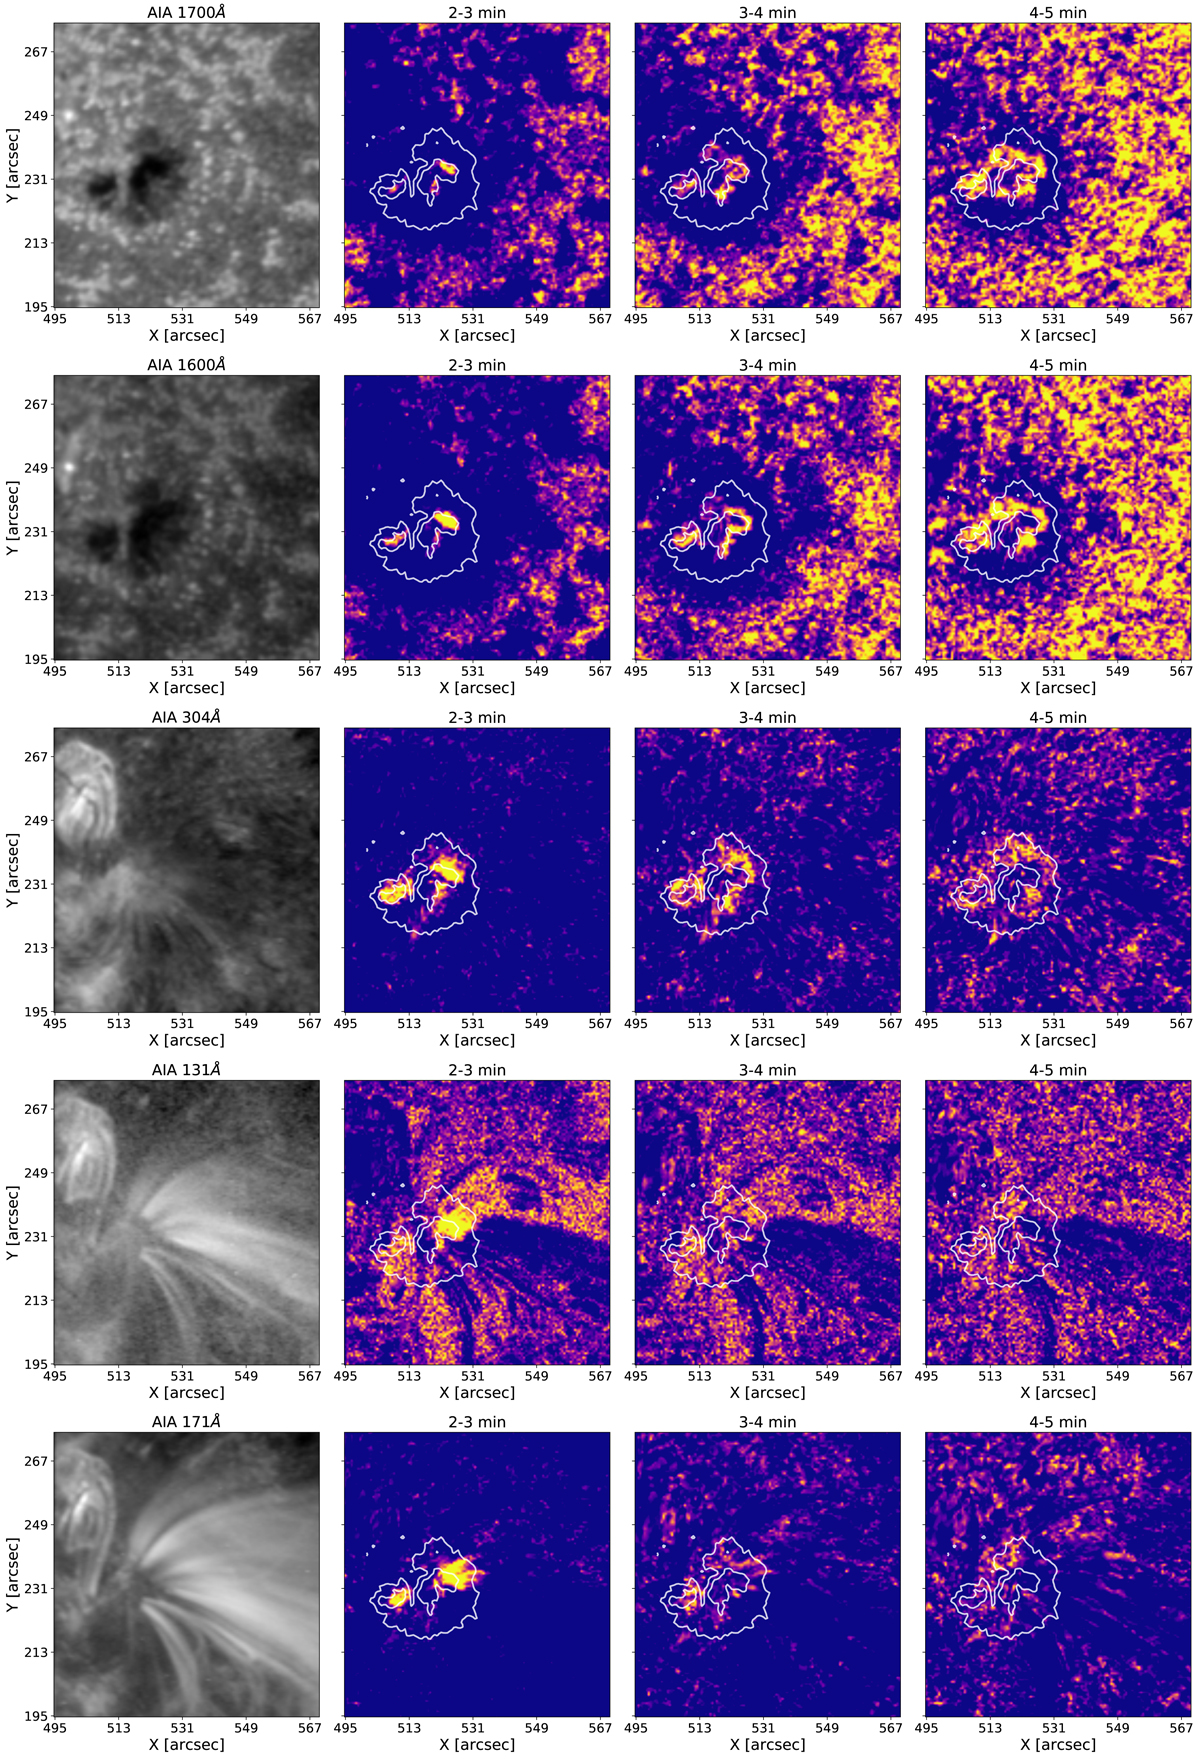
Download original image
Snapshots of the ROI (first column) taken by SDO/AIA at approximately 00:00 UT for 1700 Å, 1600 Å, 304 Å, and 171 Å (from top to bottom). Maps (from second to fourth column) showing the power distribution obtained from the periodograms calculated for each pixel of the ROI over three one-minute intervals between 2 and 5 min. The second column corresponds to the main powers obtained in the interval [2–3] min, the third to [3–4] min, and the last one to [4–5] min. The colour scales in the different columns are normalised to the same value for comparison.
Current usage metrics show cumulative count of Article Views (full-text article views including HTML views, PDF and ePub downloads, according to the available data) and Abstracts Views on Vision4Press platform.
Data correspond to usage on the plateform after 2015. The current usage metrics is available 48-96 hours after online publication and is updated daily on week days.
Initial download of the metrics may take a while.