Fig. 11.
Download original image
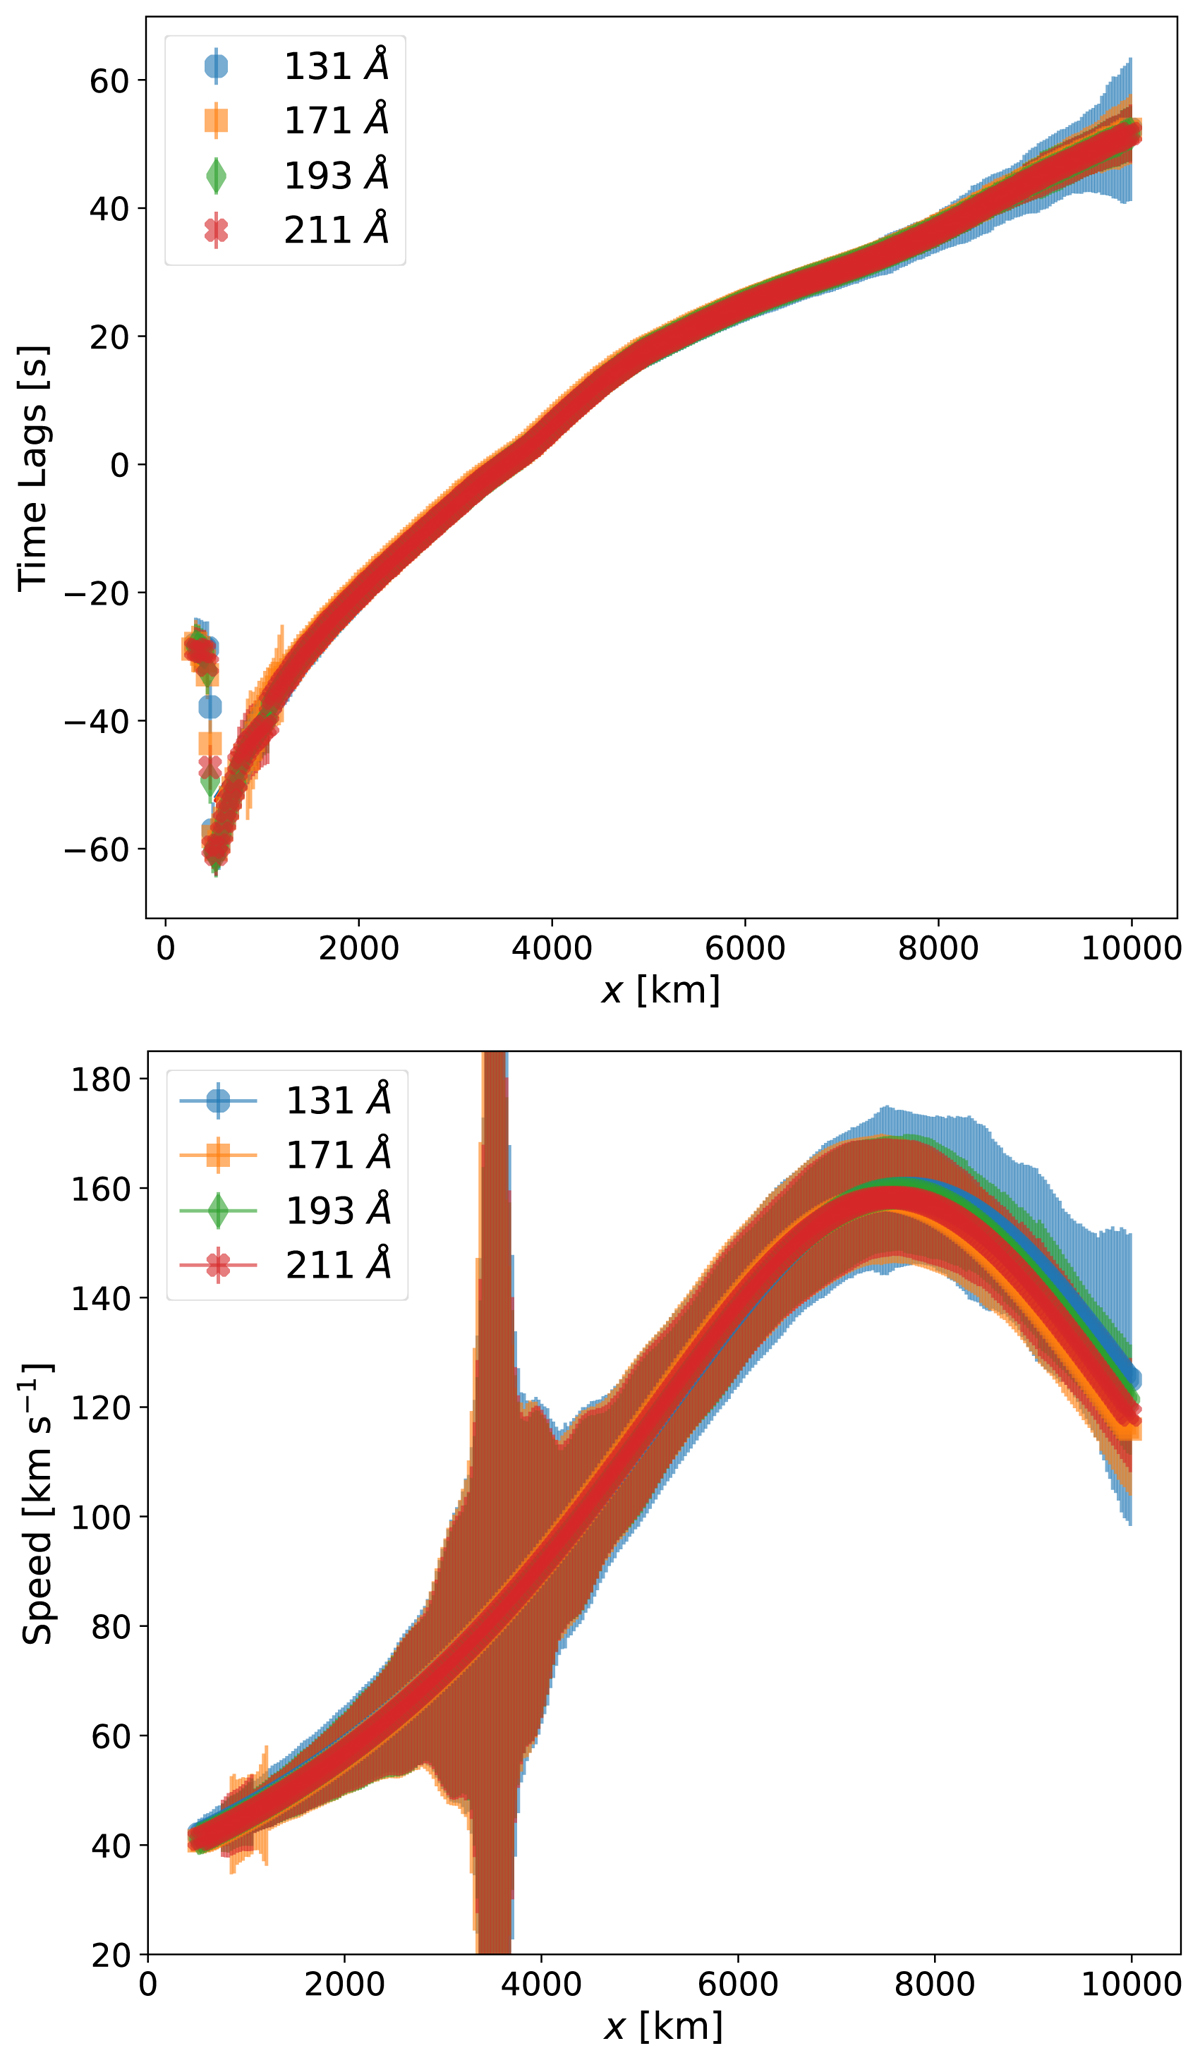
Time lags and POS speeds from synthetic t − d maps. Top panel: time lags (coloured symbols) obtained from the synthetic t − d maps for each wavelength as a function of the projected distance along the loop. Vertical bars (comparable to the size of the symbols) on these values indicate the associated errors from the quadratic fit performed to obtain the time lags. The solid lines denote spline fits to the data, which are almost indistinguishable. Bottom panel: propagation speeds obtained from the spline fits to time lag values along with the associated errors.
Current usage metrics show cumulative count of Article Views (full-text article views including HTML views, PDF and ePub downloads, according to the available data) and Abstracts Views on Vision4Press platform.
Data correspond to usage on the plateform after 2015. The current usage metrics is available 48-96 hours after online publication and is updated daily on week days.
Initial download of the metrics may take a while.