Fig. 9
Download original image
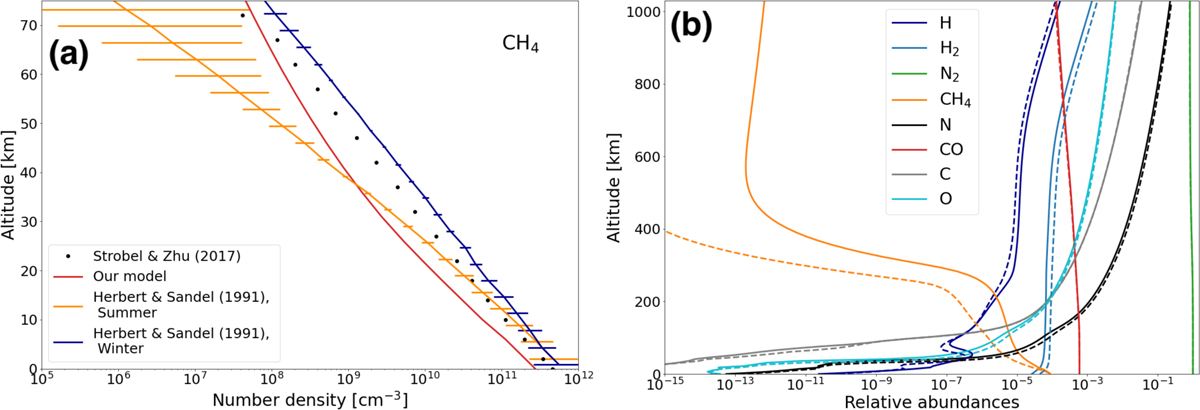
Comparison of our CH4 profile with other datasets and impact of the resolution of the solar spectrum on our results: (a) CH4 number density profiles near the surface derived from Voyager 2 data and presented in Herbert & Sandel (1991; dark blue and orange), data points from Strobel & Zhu (2017; black dots) and result from our model using nominal reaction rates (red), i.e. without considering any uncertainty. (b) Comparison of the relative abundances of the main neutral species when using a high resolution solar spectrum (solid lines) versus a low resolution spectrum
Current usage metrics show cumulative count of Article Views (full-text article views including HTML views, PDF and ePub downloads, according to the available data) and Abstracts Views on Vision4Press platform.
Data correspond to usage on the plateform after 2015. The current usage metrics is available 48-96 hours after online publication and is updated daily on week days.
Initial download of the metrics may take a while.