Open Access
Fig. 7.
Download original image
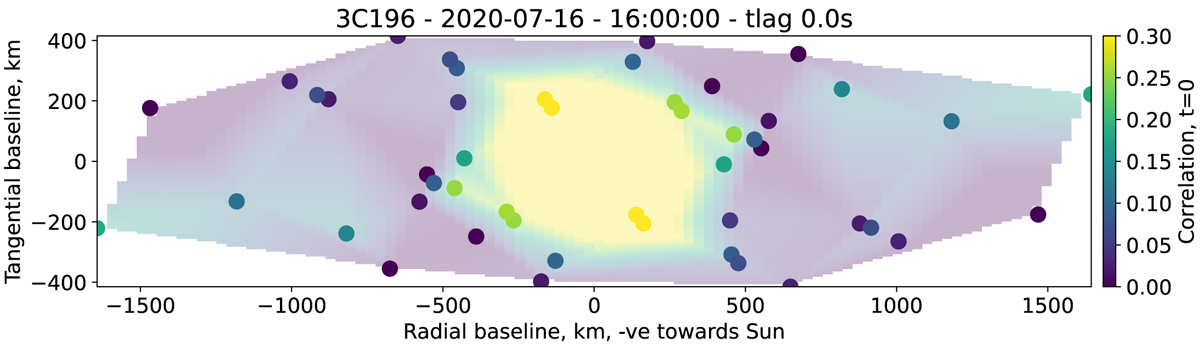
Spatial correlation image of zero time-lag values of the intensity cross-correlation functions, along with the individual data points used to form it. The minimum and maximum cross-correlation values used in the colour scale are chosen to saturate the image such that the basic shape is emphasised.
Current usage metrics show cumulative count of Article Views (full-text article views including HTML views, PDF and ePub downloads, according to the available data) and Abstracts Views on Vision4Press platform.
Data correspond to usage on the plateform after 2015. The current usage metrics is available 48-96 hours after online publication and is updated daily on week days.
Initial download of the metrics may take a while.