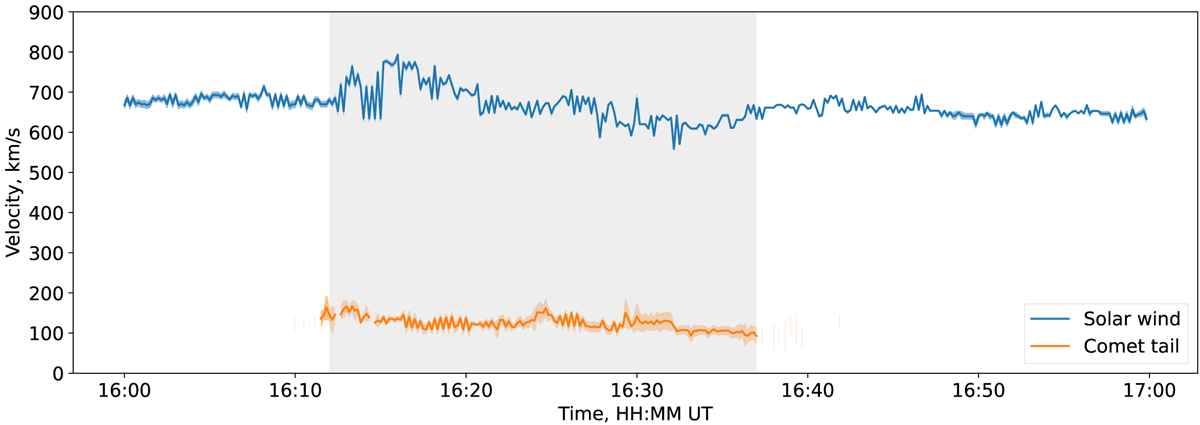
Fig. 6.
Download original image
Velocity calculated from least-squares fits to plots of radial baseline versus cross-correlation peak time lag. The velocity calculated for the background solar wind is plotted in blue, and that for the comet tail in orange. The range in velocity in each case is the standard deviation calculated from the fits, although this is too small to be easily visible here. The grey shaded area represents the period of enhanced scintillation.
Current usage metrics show cumulative count of Article Views (full-text article views including HTML views, PDF and ePub downloads, according to the available data) and Abstracts Views on Vision4Press platform.
Data correspond to usage on the plateform after 2015. The current usage metrics is available 48-96 hours after online publication and is updated daily on week days.
Initial download of the metrics may take a while.