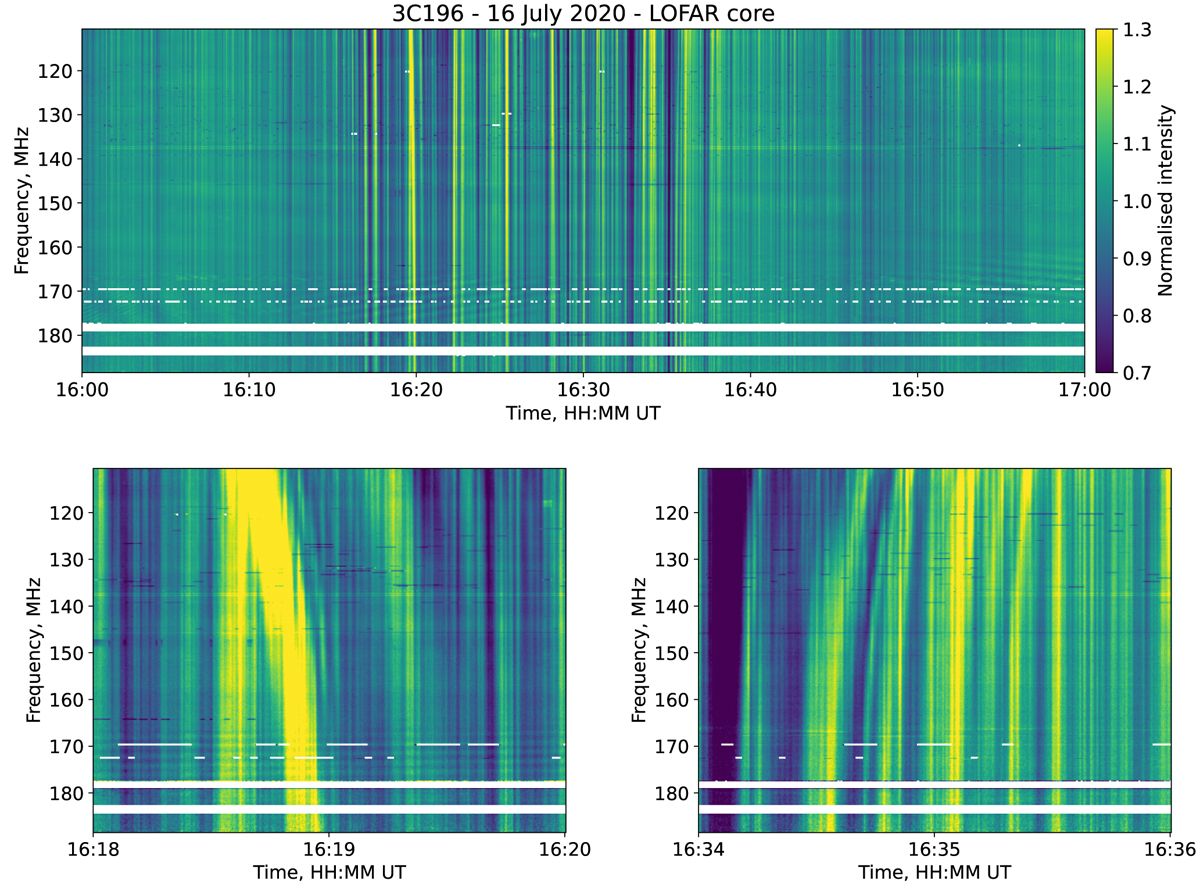
Fig. 2.
Download original image
Dynamic spectra of the variation in normalised intensity received by the LOFAR core. Top: one hour of data showing the obvious enhancement in scintillation between approximately 16:15 UT and 16:40 UT. Lower left: two minutes of data from near the start of the period of enhancement. Lower right: two minutes of data from near the end of the period of enhancement.
Current usage metrics show cumulative count of Article Views (full-text article views including HTML views, PDF and ePub downloads, according to the available data) and Abstracts Views on Vision4Press platform.
Data correspond to usage on the plateform after 2015. The current usage metrics is available 48-96 hours after online publication and is updated daily on week days.
Initial download of the metrics may take a while.