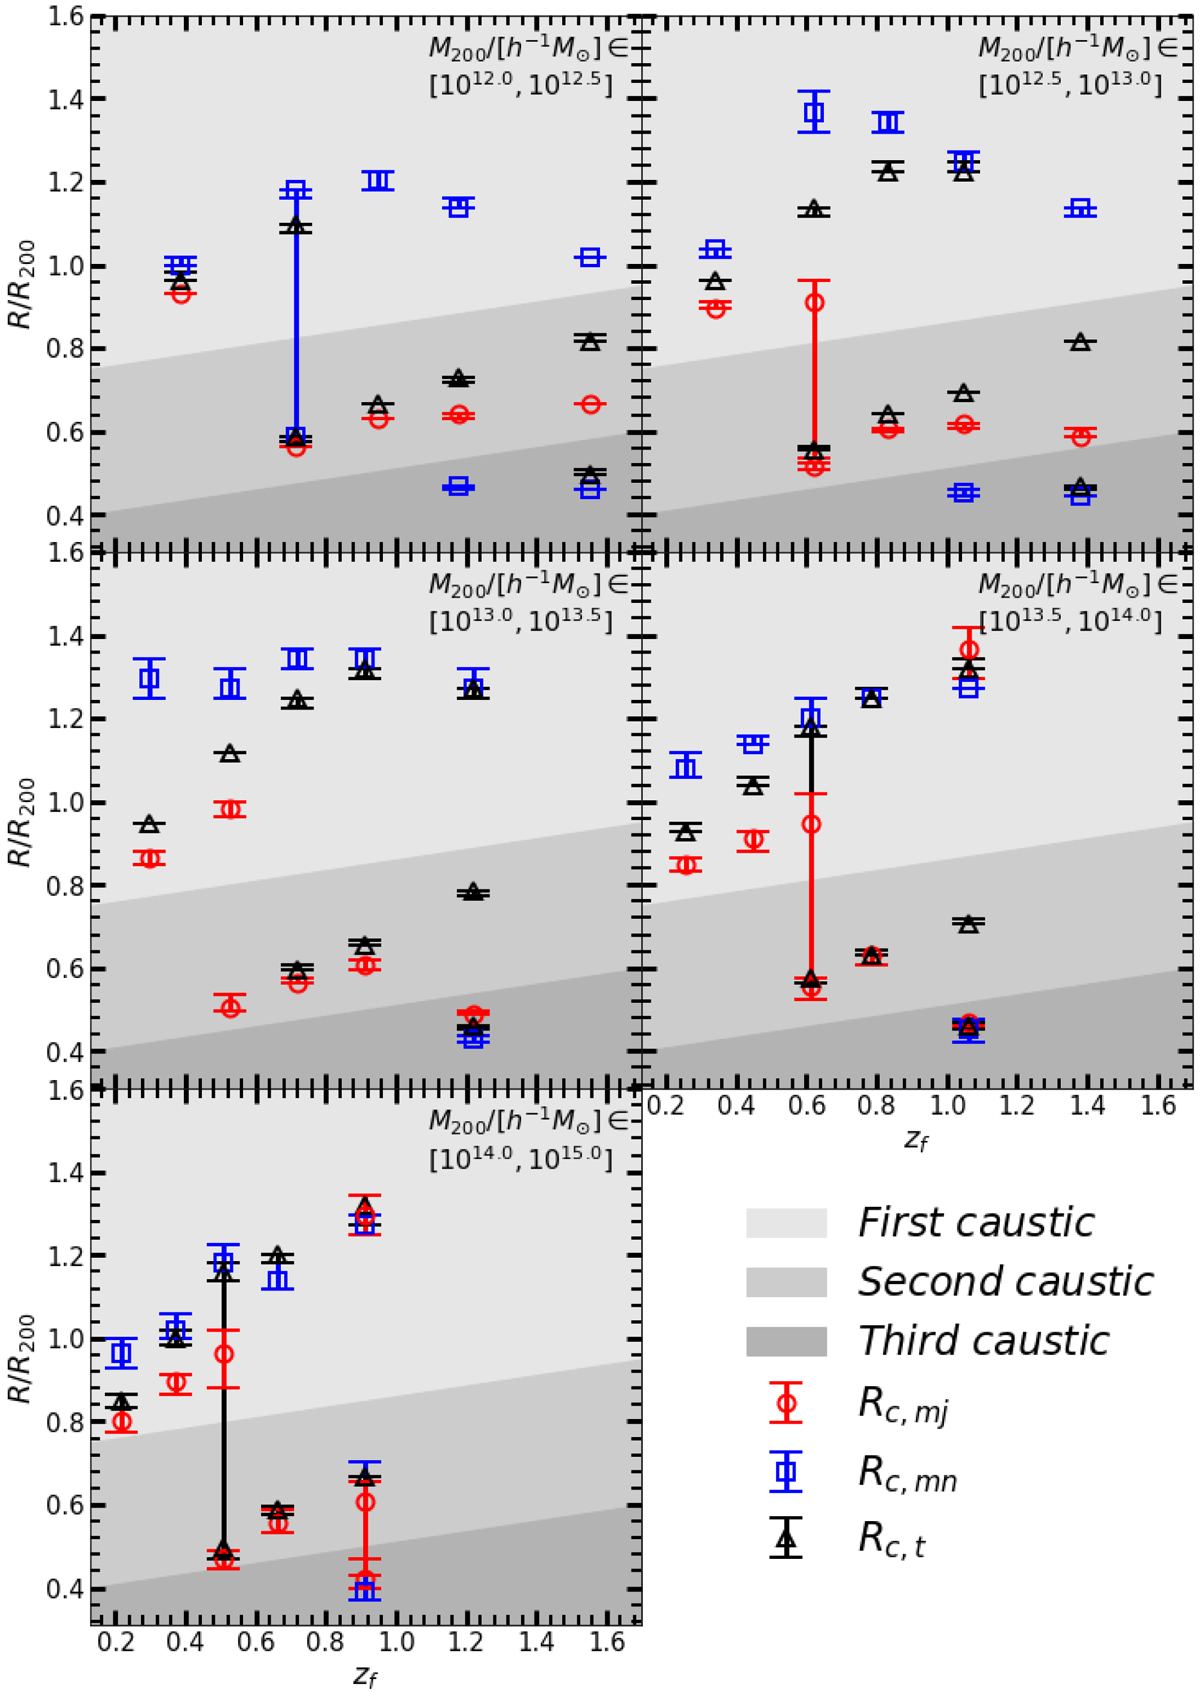
Fig. 5.
Download original image
Caustic radii measured from total (black), T1 (red), and T3 (blue) profiles as functions of formation time in different halo mass bins, as indicated in each panel. Error bars are calculated using the two-level (100 × 1000) bootstrap samples. We note that some profiles have multiple local minimums, and therefore multiple caustic radii. The shaded areas from light to dark indicate the regions where the first, second, and third caustics are located, respectively.
Current usage metrics show cumulative count of Article Views (full-text article views including HTML views, PDF and ePub downloads, according to the available data) and Abstracts Views on Vision4Press platform.
Data correspond to usage on the plateform after 2015. The current usage metrics is available 48-96 hours after online publication and is updated daily on week days.
Initial download of the metrics may take a while.