Open Access
Fig. 4.
Download original image
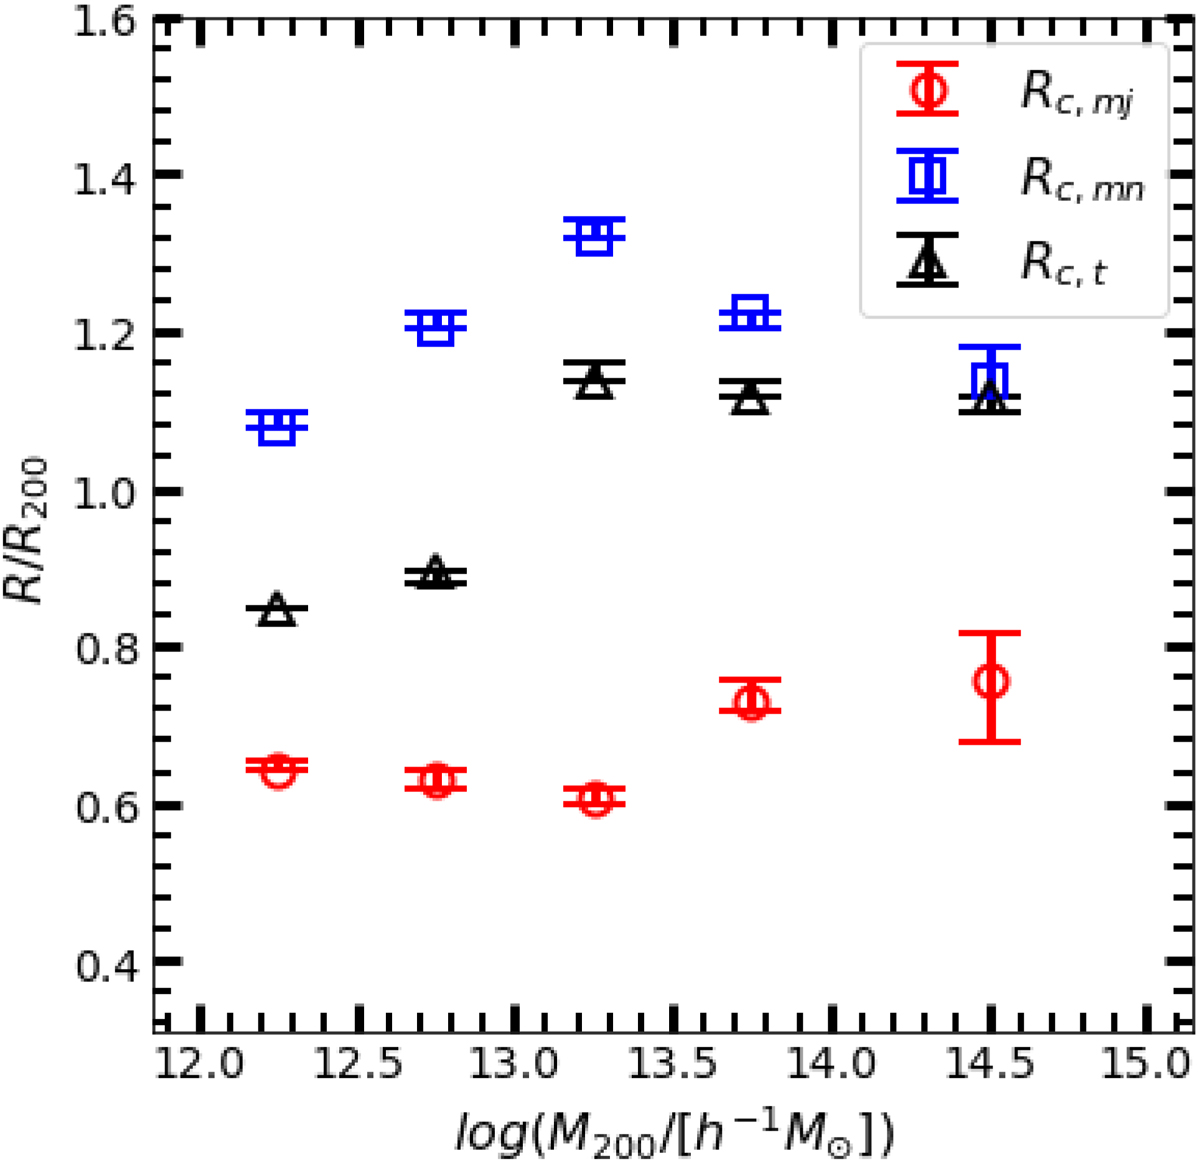
Caustic radius as a function of halo mass. The black, red, and blue symbols show the results measured from total, T1, and T3 halo density gradient profiles, respectively. Error bars are calculated using the two-level (100 × 1000) bootstrap samples (see Sect. 2.4 for the details of the method).
Current usage metrics show cumulative count of Article Views (full-text article views including HTML views, PDF and ePub downloads, according to the available data) and Abstracts Views on Vision4Press platform.
Data correspond to usage on the plateform after 2015. The current usage metrics is available 48-96 hours after online publication and is updated daily on week days.
Initial download of the metrics may take a while.