Fig. 2.
Download original image
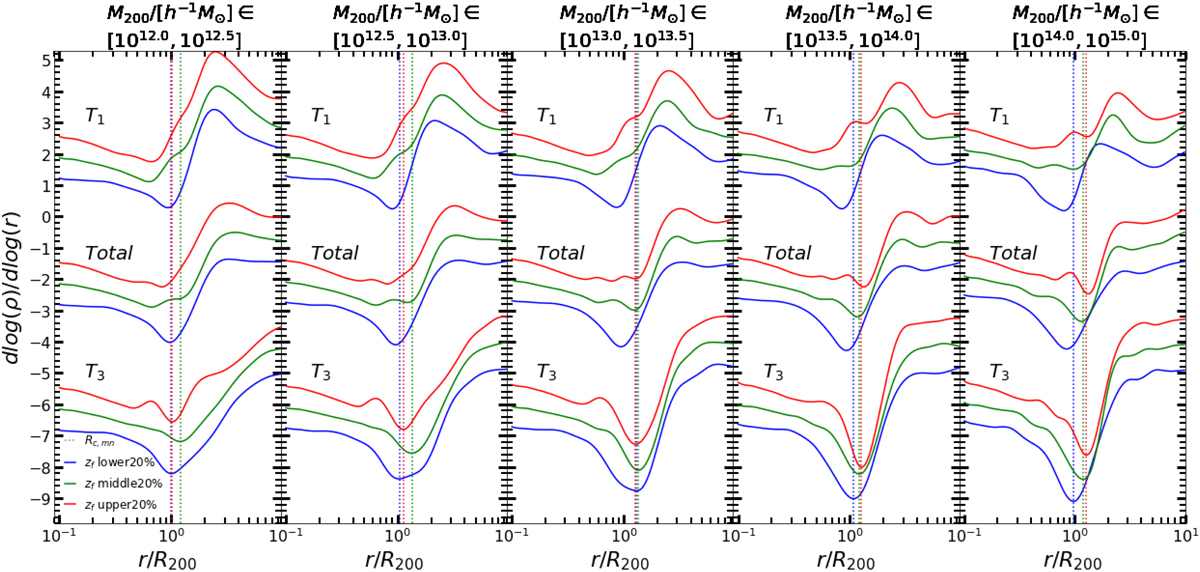
Best-fitting curves for gradient profiles. Different columns show the results of different halo mass, as indicated in each panel. The top, middle, and bottom sets of curves show the T1, total, and T3 profiles, respectively. The profiles are shifted up or down for the purpose of presentation. The red, green, and blue lines represent halos in the upper, middle, and lower 20% of the zf distribution in each mass bin. The vertical dotted lines indicate the splashback radii (the first caustic radii) determined from the T3 profiles (see texts for details).
Current usage metrics show cumulative count of Article Views (full-text article views including HTML views, PDF and ePub downloads, according to the available data) and Abstracts Views on Vision4Press platform.
Data correspond to usage on the plateform after 2015. The current usage metrics is available 48-96 hours after online publication and is updated daily on week days.
Initial download of the metrics may take a while.