Fig. 12.
Download original image
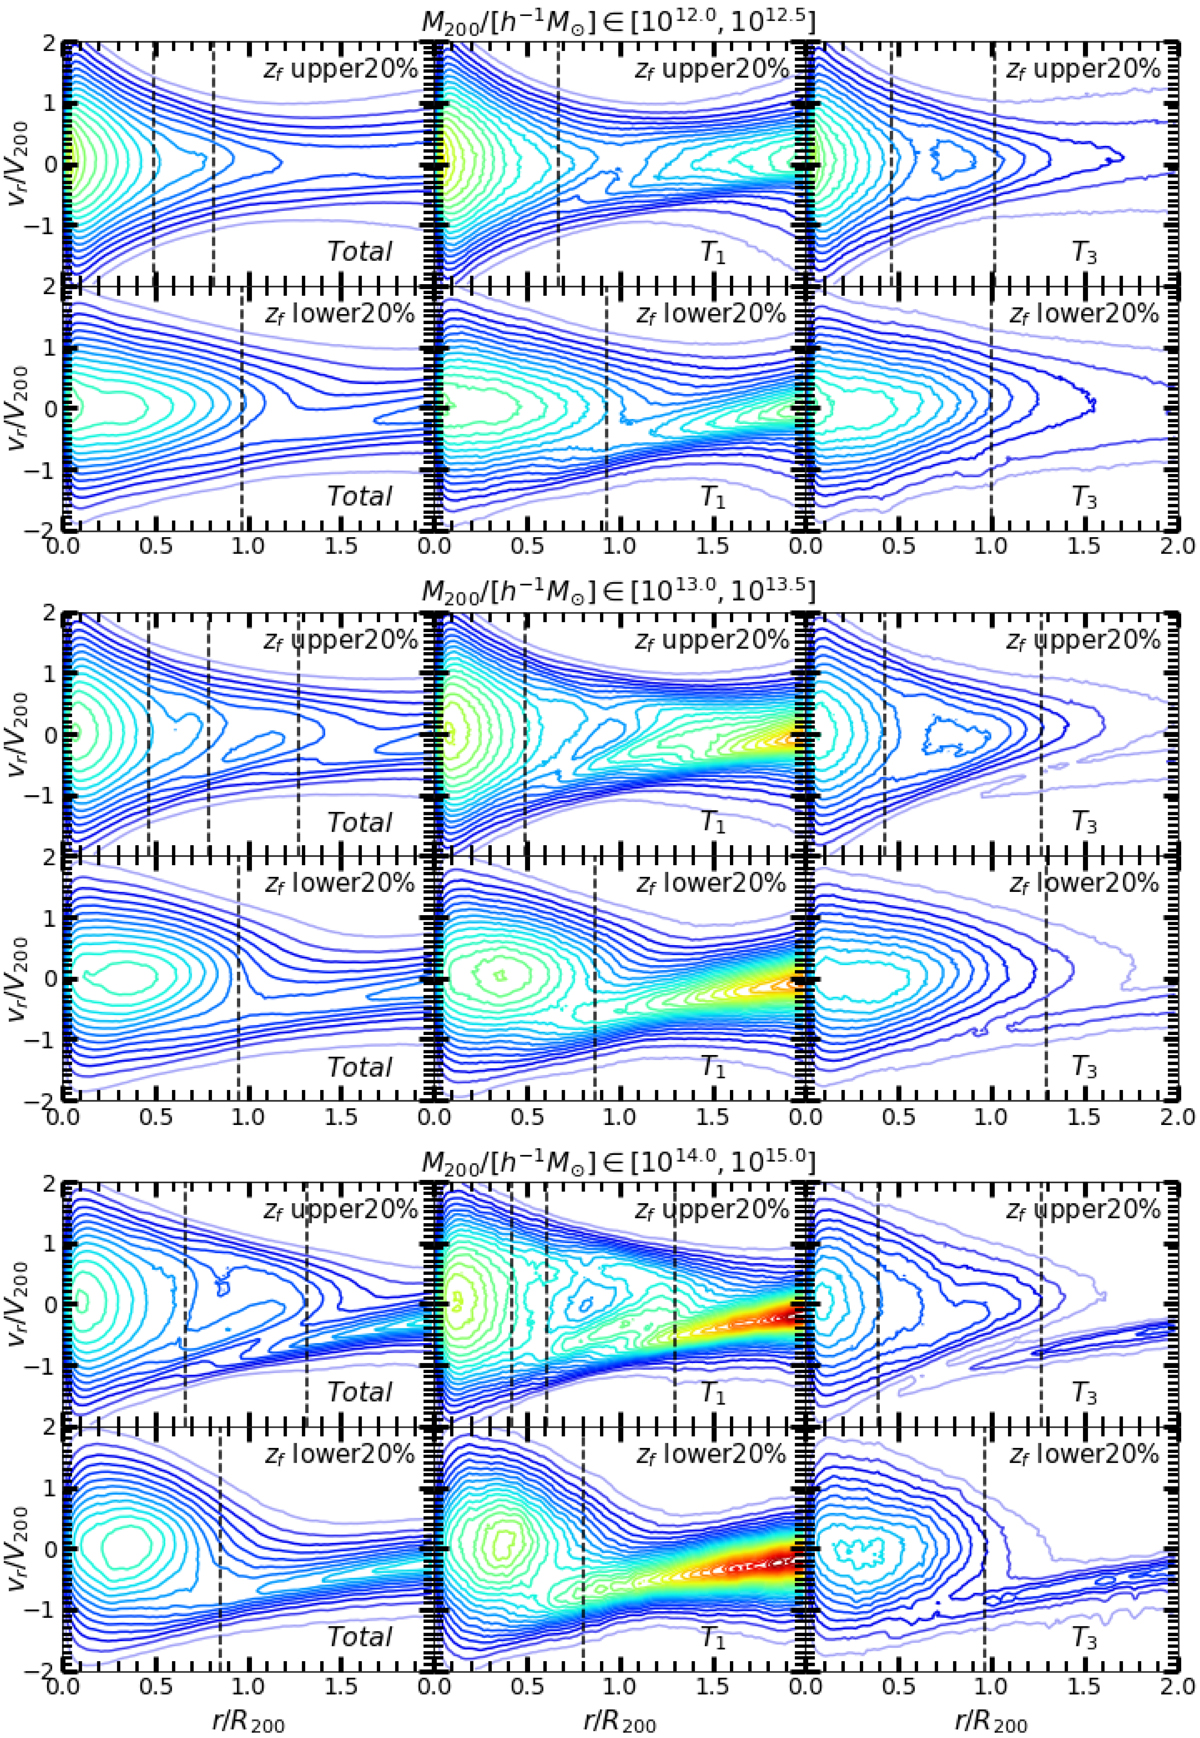
Phase space diagrams of dark matter particles for halos with different zf and M200. The panels are split into three groups according to the halo mass. In each group, the upper (lower) panels show the results for the oldest (youngest) 20% halos, respectively. The left, middle, and right columns show the results averaged over all directions (labeled as “total”), along T1 and T3, respectively. The contour lines are color coded according to the phase space density (see Eq. (4)); red(blue) means high(low) density. The black dashed lines indicate the caustic radii measured from gradient profiles.
Current usage metrics show cumulative count of Article Views (full-text article views including HTML views, PDF and ePub downloads, according to the available data) and Abstracts Views on Vision4Press platform.
Data correspond to usage on the plateform after 2015. The current usage metrics is available 48-96 hours after online publication and is updated daily on week days.
Initial download of the metrics may take a while.